This is the configuration for domain mode, but standalone is probably pretty close to the same thing.
Configuring JVM SNMP
In domain.xml, you need to add the following system-properties (make sure to create an snmp.acl file someplace with super-restrictive permissions, otherwise the jvm will get really pissy):
<system-properties>
...
<property name="java.util.logging.manager" value="org.jboss.logmanager.LogManager"/>
<property name="jboss.modules.system.pkgs" value="org.jboss.byteman,org.jboss.logging,org.jboss.logmanager,org.jboss.log4j.logmanager"/>
<property name="com.sun.management.snmp.acl.file" value="/path/to/snmp.acl"/>
<property name="com.sun.management.snmp.acl" value="true"/>
<property name="com.sun.management.snmp.interface" value="0.0.0.0"/>
</system-properties>
And for each server group, add the following jvm options (make sure to update the paths):
<server-group name="your-server-group" profile="full">
<jvm name="default">
<jvm-options>
<option value="-Xbootclasspath/a:/path/to/jboss-eap-6.0/modules/org/jboss/logging/main/jboss-logging-3.1.2.GA-redhat-1.jar:/path/to/jboss-eap-6.0/modules/org/jboss/logmanager/main/jboss-logmanager-1.3.2.Final-redhat-1.jar:/path/to/jboss-eap-6.0/modules/org/jboss/log4j/logmanager/main/log4j-jboss-logmanager-1.0.1.Final-redhat-2.jar"/>
</jvm-options>
...
</jvm>
...
</server-group>
And now for the shitty part- in the host.xml, you need to add a system property for each server, explicitly setting the snmp port you want to use- you can't just use the port offset or a variable value because eap is not technically "managing that" according to redhat. Note that the port number has to be different for each worker on the same box.
<server name="server-1" group="your-server-group" auto-start="true">
...
<system-properties>
<property name="com.sun.management.snmp.port" value="4161"/>
</system-properties>
</server>
And that should be all you need to get snmp up and running.
Trending Heap, Non-Heap and Threads
From here you can create an icinga/nagios command with check_snmp that looks like this:
define command{
command_name check_tomcat_memory
command_line $USER1$/check_snmp -t 20 -H $HOSTADDRESS$ -P 2c -C $ARG1$ -p $ARG2$ -o $ARG3$ $ARG4$
}
define command{
command_name check_tomcat_threads
command_line $USER1$/check_snmp -t 20 -H $HOSTADDRESS$ -P 2c -C $ARG1$ -p $ARG2$ -o $ARG3$ $ARG4$
}
and then add checks that look like this:
define service {
hostgroup_name scd-appservers
use generic-service,trendable
service_description scd heap
check_command check_tomcat_memory!$USER5$!3161!.1.3.6.1.4.1.42.2.145.3.163.1.1.2.11.0,.1.3.6.1.4.1.42.2.145.3.163.1.1.2.12.0,.1.3.6.1.4.1.42.2.145.3.163.1.1.2.13.0!-l jvmHeapUsed -l jvmHeapCommitted -l jvmHeapMax -u bytes -u bytes -u bytes
max_check_attempts 3
notification_options c,u,r
register 1
}
define service {
hostgroup_name scd-appservers
use generic-service,trendable
service_description scd non-heap
check_command check_tomcat_memory!$USER5$!3161!.1.3.6.1.4.1.42.2.145.3.163.1.1.2.21.0,.1.3.6.1.4.1.42.2.145.3.163.1.1.2.22.0,.1.3.6.1.4.1.42.2.145.3.163.1.1.2.23.0!-l jvmNonHeapUsed -l jvmNonHeapCommitted -l jvmNonHeapMax -u bytes -u bytes -u bytes
max_check_attempts 3
notification_options c,u,r
register 1
}
define service {
hostgroup_name scd-appservers
use generic-service,trendable
service_description scd threads
check_command check_tomcat_threads!$USER5$!3161!.1.3.6.1.4.1.42.2.145.3.163.1.1.3.1.0,.1.3.6.1.4.1.42.2.145.3.163.1.1.3.3.0!-l jvmThreadCount -l jvmThreadPeakCount -u threads -u threads
max_check_attempts 3
notification_options c,u,r
register 1
}
And for a finishing touch, Lets configure pnp4nagios. Since the JVM stupidly returns these values as counters rather than gauges, we need to force pnp4nagios to use them as gauges.
In /etc/pnp4nagios/check_commands/check_tomcat_memory.cfg:
CUSTOM_TEMPLATE = 0
DATATYPE = GAUGE
RRD_STORAGE_TYPE = SINGLE
In /etc/pnp4nagios/check_commands/check_tomcat_threads.cfg:
CUSTOM_TEMPLATE = 0
DATATYPE = GAUGE
RRD_STORAGE_TYPE = SINGLE
And then you can use this as a template in /etc/pnp4nagios/templates/check_tomcat_memory.php:
<?php
$ds_name[0] = $servicedesc." ($hostname)";
$opt[0] = "--vertical-label \"Memory Usage (MB)\" -l 0 --title \"".$ds_name[0]."\" ";
$def[0]="";
# Memory definition
$def[0] .= rrd::def("var1", $RRDFILE[1], $DS[1]);
$def[0] .= rrd::def("var2", $RRDFILE[1], $DS[2]);
$def[0] .= rrd::def("var3", $RRDFILE[1], $DS[3]);
$def[0] .= rrd::cdef($NAME[1], 'var1,1024,/,1024,/' );
$def[0] .= rrd::cdef($NAME[2], 'var2,1024,/,1024,/' );
$def[0] .= rrd::cdef($NAME[3], 'var3,1024,/,1024,/' );
$def[0] .= rrd::gradient($NAME[3], "#ffffff", "#cceeee", $NAME[3]."\\t\\t");
$def[0] .= rrd::line1( $NAME[3], "#ddcccc");
$def[0] .= rrd::gprint( $NAME[3], "LAST", "last\: %4.lf mb\\t");
$def[0] .= rrd::gprint( $NAME[3], "MAX", "max\: %4.lf mb\\t");
$def[0] .= rrd::gprint( $NAME[3], "AVERAGE", "average\: %4.2lf mb\\n");
$def[0] .= rrd::gradient($NAME[2], "#ffffff", "#ccaaaa", $NAME[2]."\\t");
$def[0] .= rrd::line1( $NAME[2], "#aacccc");
$def[0] .= rrd::gprint( $NAME[2], "LAST", "last\: %4.lf mb\\t");
$def[0] .= rrd::gprint( $NAME[2], "MAX", "max\: %4.lf mb\\t");
$def[0] .= rrd::gprint( $NAME[2], "AVERAGE", "average\: %4.2lf mb\\n");
$def[0] .= rrd::gradient($NAME[1], "#ffffff", "#33cccc", $NAME[1]."\\t\\t");
$def[0] .= rrd::line1( $NAME[1], "#339999" );
$def[0] .= rrd::gprint( $NAME[1], "LAST", "last\: %4.lf mb\\t");
$def[0] .= rrd::gprint( $NAME[1], "MAX", "max\: %4.lf mb\\t");
$def[0] .= rrd::gprint( $NAME[1], "AVERAGE", "average\: %4.2lf mb\\n");
?>
And for threads, use this in /etc/pnp4nagios/templates/check_tomcat_threads.php:
<?php
$ds_name[0] = $servicedesc." ($hostname)";
$opt[0] = "--vertical-label \"Thread usage\" -l 0 --title \"".$ds_name[0]."\" ";
$def[0]="";
$def[0] .= rrd::def("var1", $RRDFILE[1], $DS[1]);
$def[0] .= rrd::def("var2", $RRDFILE[1], $DS[2]);
$def[0] .= rrd::cdef($NAME[1], 'var1' );
$def[0] .= rrd::cdef($NAME[2], 'var2' );
$def[0] .= rrd::gradient($NAME[2], "#ffffff", "#ccaaaa", $NAME[2]."\\t");
$def[0] .= rrd::line1( $NAME[2], "#aacccc");
$def[0] .= rrd::gprint( $NAME[2], "LAST", "last\: %4.lf\\t");
$def[0] .= rrd::gprint( $NAME[2], "MAX", "max\: %4.lf\\t");
$def[0] .= rrd::gprint( $NAME[2], "AVERAGE", "average\: %4.2lf\\n");
$def[0] .= rrd::gradient($NAME[1], "#ffffff", "#33cccc", $NAME[1]."\\t");
$def[0] .= rrd::line1( $NAME[1], "#339999" );
$def[0] .= rrd::gprint( $NAME[1], "LAST", "last\: %4.lf\\t");
$def[0] .= rrd::gprint( $NAME[1], "MAX", "max\: %4.lf\\t");
$def[0] .= rrd::gprint( $NAME[1], "AVERAGE", "average\: %4.2lf\\n");
?>
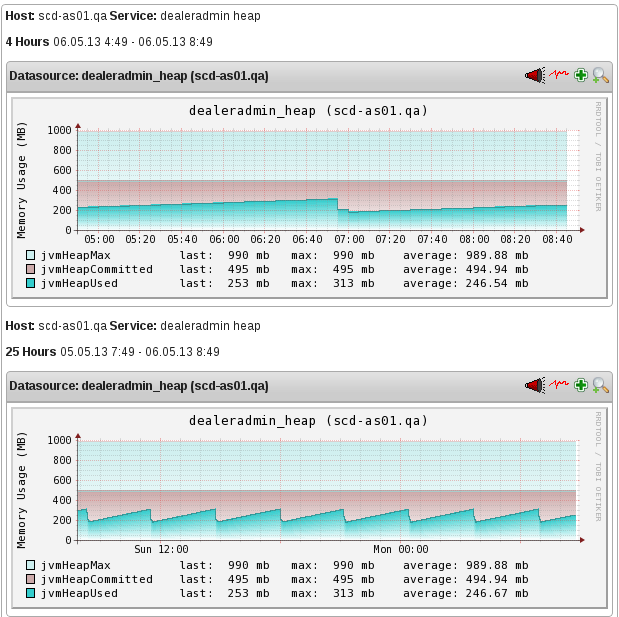
And with a little bit of luck, you should end up with something like this:
Comments