Em muitas situações podemos desejar verificar informações sobre a execução de querys no Hibernate, como tempo médio de resposta ou até mesmo se o cache foi utilizado. Uma maneira bem simples de obtermos essas informações é utilizando a propriedade hibernate.cache.infinispan.statistics , já que por padrão essa funcionalidade vem desabilitada no JBoss AS 7 ( Infinispan ).
Para o persistence.xml utilize:
<property name="hibernate.cache.infinispan.statistics" value="true"/>
Já para o hibernate.cfg.xml utilize:
<property name="hibernate.cache.infinispan.statistics">true</property>
Para visualizar as informações geradas pelo Hibernate Statistics o JConsole pode ser utilizado ou o JBoss CLI:
[standalone@localhost:9999 /] /deployment=coolstore.war/subsystem=jpa/hibernate-persistence-unit=coolstore.war#forge-default:read-resource(include-runtime=true)
{
    "outcome" => "success",
    "result" => {
        "close-statement-count" => 0L,
        "collection" => undefined,
        "collection-fetch-count" => 0L,
        "collection-load-count" => 0L,
        "collection-recreated-count" => 0L,
        "collection-remove-count" => 0L,
        "collection-update-count" => 0L,
        "completed-transaction-count" => 0L,
        "connect-count" => 0L,
        "enabled" => false,
        "entity-cache" => undefined,
        "entity-delete-count" => 0L,
        "entity-fetch-count" => 0L,
        "entity-insert-count" => 0L,
        "entity-load-count" => 0L,
        "entity-update-count" => 0L,
        "flush-count" => 0L,
        "optimistic-failure-count" => 0L,
        "prepared-statement-count" => 0L,
        "query-cache" => undefined,
        "query-cache-hit-count" => 0L,
        "query-cache-miss-count" => 0L,
        "query-cache-put-count" => 0L,
        "query-execution-count" => 0L,
        "query-execution-max-time" => 0L,
        "query-execution-max-time-query-string" => undefined,
        "scoped-unit-name" => "coolstore.war#forge-default",
        "second-level-cache-hit-count" => 0L,
        "second-level-cache-miss-count" => 0L,
        "second-level-cache-put-count" => 0L,
        "session-close-count" => 0L,
        "session-open-count" => 0L,
        "successful-transaction-count" => 0L,
        "entity" => {"com.example.coolstore.model.Book" => undefined}
    }
}
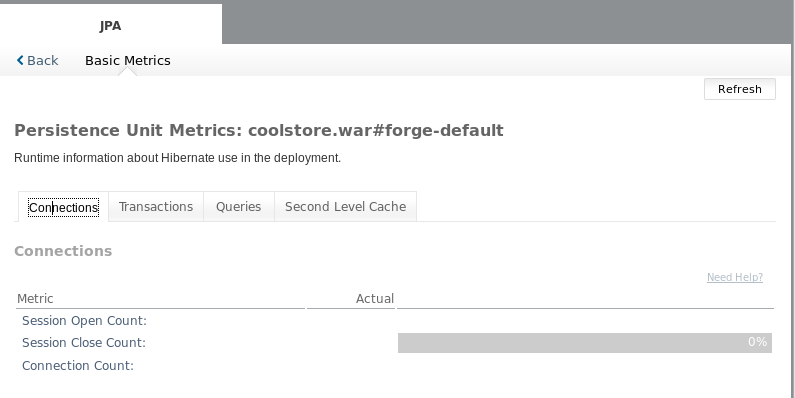
No Web Console também é possível visualizar essas informações:
Uma boa referência para inciar os testes é o artigo da Caelum http://blog.caelum.com.br/cacando-seus-gargalos-com-o-hibernate-statistics/.
Uma outra fonte interessante é http://www.mastertheboss.com/jboss-performance/jboss-as-7-performance-tuning/page-6.
Abraços
Comments