JAM-APPLICATION-METRICS
JAM-Application-Metrics is a project, which intends to facilitate the creation, record and monitoring of metrics for any deployment. Using the power on interceptors and reflection the only thing that the developer has to do is to annotate the class or the method where lies the field-metric he wants to record by using the annotation @Metric(fieldName = {"field name of first metric","field name of second metric", etc}, groupName="some name characteristic to the metric group"). This way the field-metric will be automatically recorded in the metrics-cache and also monitored by RHQ (http://rhq-project.github.io/rhq/) and Hawkular. It is the initial project JBoss-Automated-Metrics which is renamed.
JAM-Application-Metric FEATURES :
1. Cache-Storage of Metrics.
2. Database-Storage of Metrics.
3. Monitoring of Metrics using RHQ.
4. Monitoring of Metrics using Hawkular and Grafana.
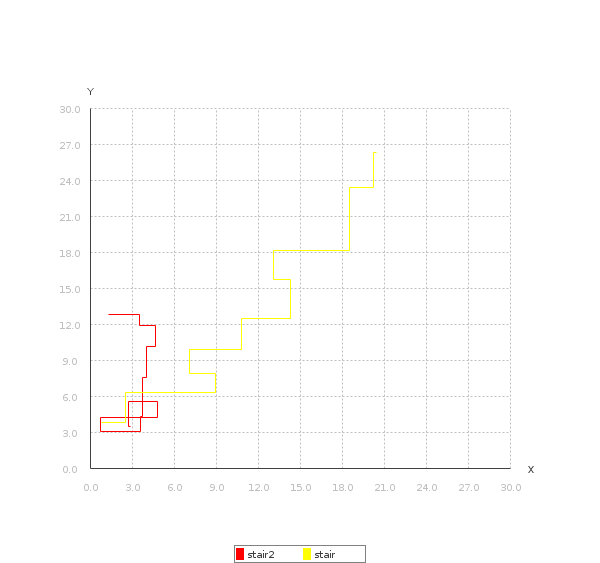
5. Creation of 2D and 3D Metric Plots.
JAM-Application-Metrics ARCHITECTURE
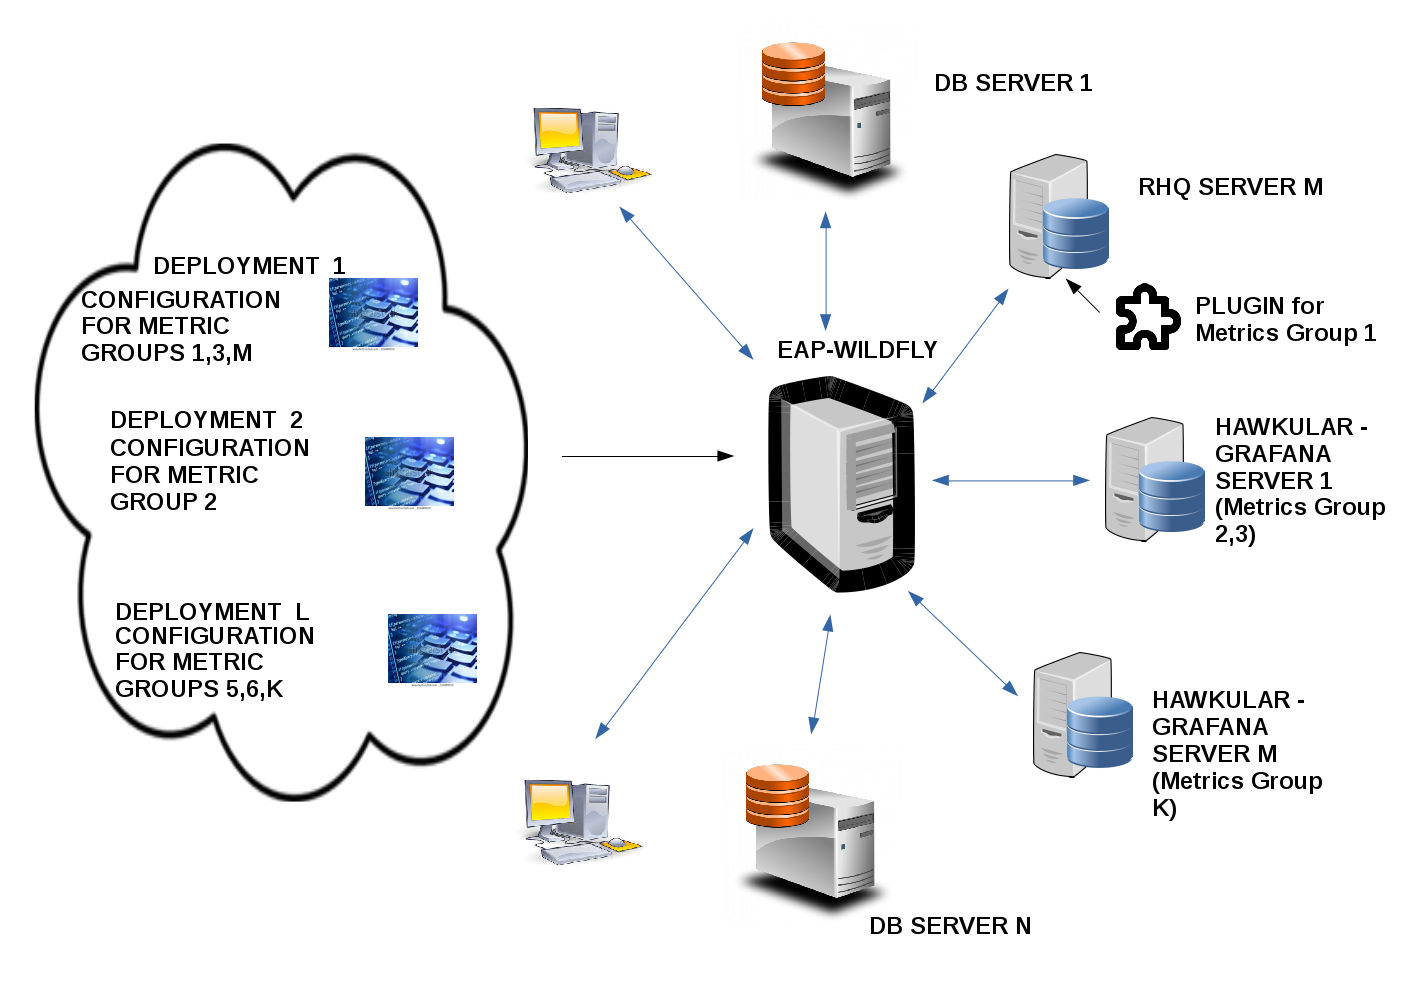
How To Use
Just annotate the method of your ejb, or your injectable class in the general case, with the annotation @Metric(fieldName = {"field name of first metric","field name of second metric", etc}, groupName="some name characteristic to the metric group"). This is sufficient for the field-metrics to be recorded in the metrics-cache. An example of usage can be found under the folder ApplicationMetricsApiTest (https://github.com/panossot/jam-metrics ). Deploy the generated .war file on the Wildfly server to see the metrics being printed.
For example, if we annotate the countMethod method below, with the annotation @Metric(fieldName = {"count","count2"}, groupName="myTestGroup") :
@Stateful
@LocalBean
public class MetricsApiSessionBean {

    private int count = 0;

    private int count2 = 0;

    public MetricsApiSessionBean() {
    }

    @Metric(fieldName = {"count","count2"}, grouptName = "myTestGroup")  // The annotation parameter groupName is used for grouping of metrics under the same metric-properties configuration.
    public int countMethod() {
        count++;
        count2 += 2;

        return count;
    }

}
and we call the method countMethod two sequential times :
public class PrintMetrics extends HttpServlet {
    @EJB
    private MetricsApiSessionBean metricsApiSessionBean;

    private String grouptName = "myTestGroup";  // The annotation parameter groupName is used for grouping of metrics under the same metric-properties configuration.

    protected void processRequest(HttpServletRequest request, HttpServletResponse response)
            throws ServletException, IOException {
        response.setContentType("text/html;charset=UTF-8");
        initializeMetricProperties();  // Using JBoss MetricsPropertiesApi to configure JBoss-Automated-Metrics.  All the configuration needed is done inside the deployment (no xml configurations needed, no System Properties to be set)

        try (PrintWriter out = response.getWriter()) {
            out.println("<!DOCTYPE html>");
            out.println("<html>");
            out.println("<head>");
            out.println("<title>Servlet PrintMetrics</title>");
            out.println("</head>");
            out.println("<body>");
            out.println("<h1>Servlet PrintMetrics : </h1>");
            metricsApiSessionBean.countMethod();
            metricsApiSessionBean.countMethod();
            out.println(MetricsCacheApi.printMetricsCache(groupName));
            out.println("<br>Successful Run ...</br>");
            out.println("</body>");
            out.println("</html>");
        }
    }

    private void initializeMetricProperties() {
        HashMap<String,String> rhqScheduleIds = new HashMap<String,String>();
        rhqScheduleIds.put("count", "11401");   // 1st Metric-Field name - Equivalent Schedule Id (Retrieved from the RHQ resources - http://RHQserverUrl:7080/rest/resource?ps=99999)
        rhqScheduleIds.put("count2", "11402");  // 2nd  Metric-Field name - Equivalent Schedule Id (Retrieved from the RHQ resources - http://RHQserverUrl:7080/rest/resource?ps=99999)
        MetricProperties metricProperties = new MetricProperties();
        metricProperties.setRhqMonitoring("true");  // Enabling the RHQ Monitoring operation.
        metricProperties.setCacheStore("true");  // Enabling the Cache Storage operation.
        metricProperties.setRhqServerUrl("lz-panos-jon33.bc.jonqe.lab.eng.bos.redhat.com");  // Adding the RHQ server URL.
        metricProperties.setRhqScheduleIds(rhqScheduleIds);  // Adding the RHQ Schedule Ids of the metrics we want to monitor.
        MetricsPropertiesApi.storeProperties(groupName, metricProperties);
    }
                                            .
                                            .

}
then the field-metrics will be automatically stored in our metrics cache :
Metric Field Name : count (of instance org.jboss.metrics.MetricsApiSessionBean@43f98edf)
Value : 1
Value : 2
Metric Field Name : count2 (of instance org.jboss.metrics.MetricsApiSessionBean@43f98edf)
Value : 2
Value : 4
As mentioned above there is also the possibility of monitoring the metrics using RHQ. To do this please perform the following steps :
- Firstly, download and configure the RHQ Server
- Change the rhq-plugin.xml located in MetricsRhqPlugin folder with the metrics that you want to monitor
- Build the plugin and load it on RHQ
- At this point, you should be able to see your MetricsServer under the Resources of RHQ (e.g. http://localhost:7080/rest/resource?ps=99999)
- Check the schedule ids of the metrics you want to monitor and configure Jam-application-metrics using JBossApplicationMeticsProperties api (Please, check initializeMetricProperties() of the example above).
- Enable the RHQ Monitoring Operation using JBossApplicationMeticsProperties api (Please, check the method initializeMetricProperties() of the example above).
- At this point, you should be able to use the operations of the JAM-Application-Metrics that you have activated.
and you will see your metrics being monitored :
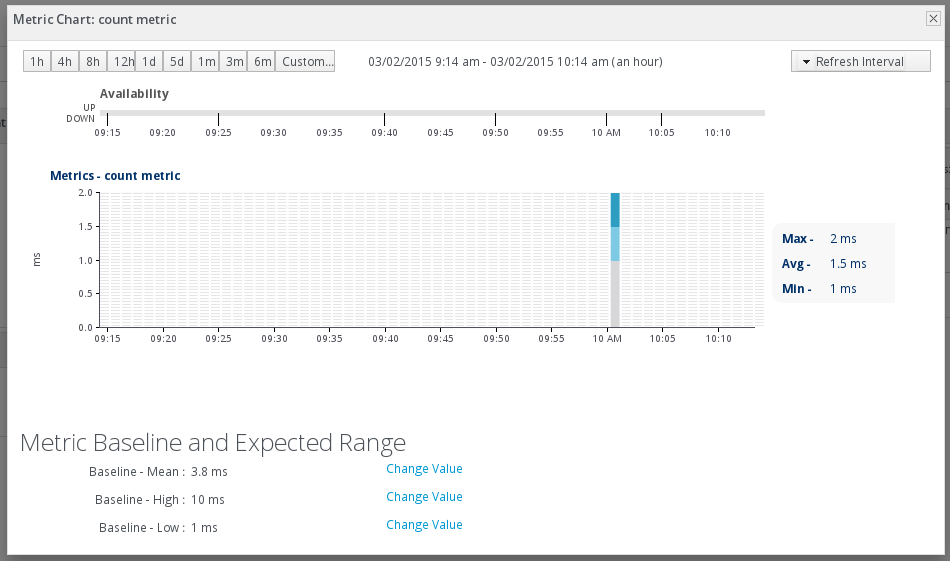
count metric
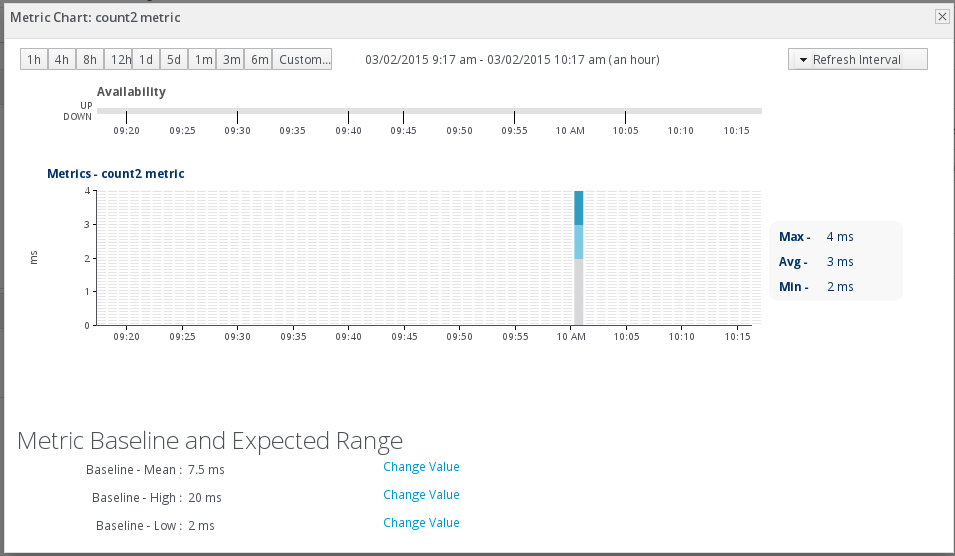
count2 metric
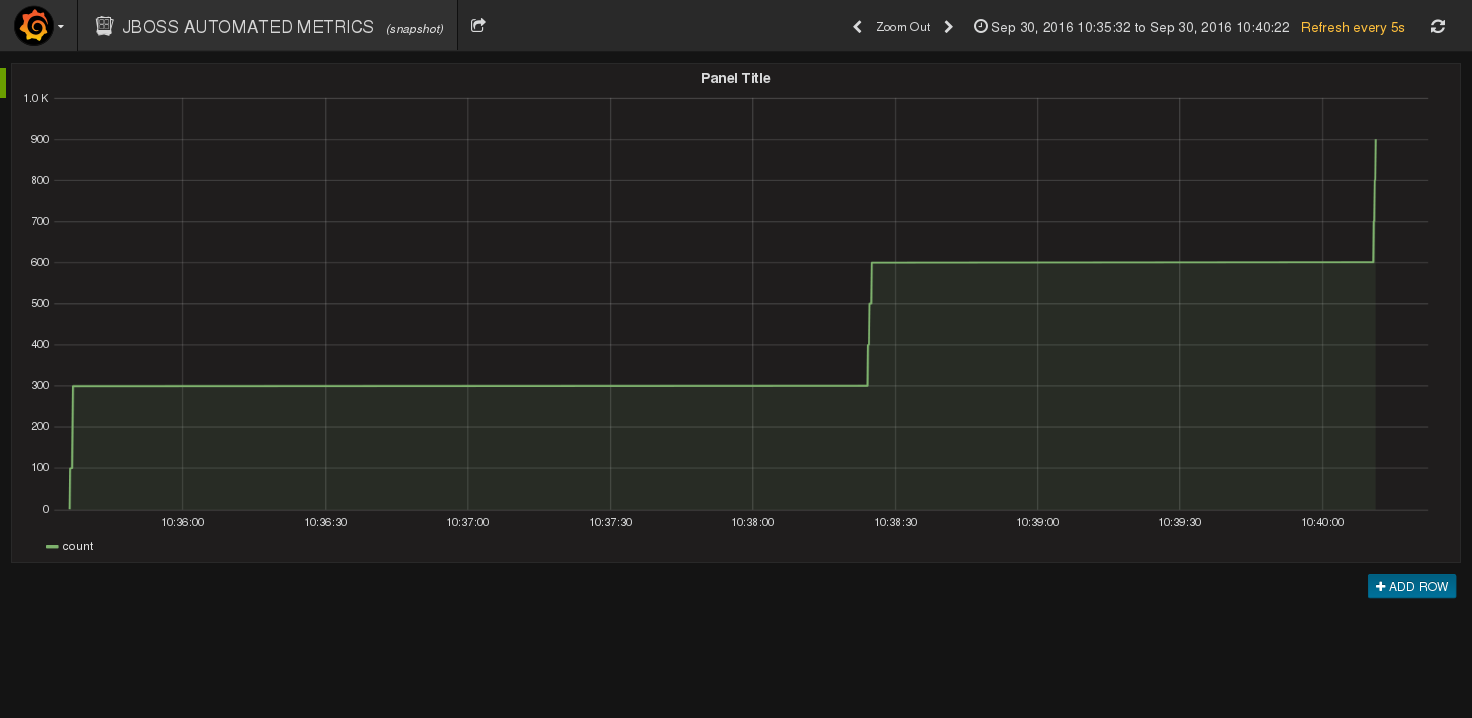
Monitoring JAM Metrics with HAWKULAR and GRAFANA
If any help is needed using grafana with hawkular, please refer to the Hawkular-Grafana QuickStart Guide : Hawkular - Grafana Quickstart Guide .
In order to enable hawkular-grafana monitoring, first, we should enable/parametrize the Hawkular Monitoring and the Cache Storage :
      MetricProperties metricProperties = new MetricProperties();
      metricProperties.setHawkularMonitoring("true");
      metricProperties.setHawkularMonitoringRefreshRate(100);
      metricProperties.setHawkularTenant("hawkular");
      metricProperties.setCacheStore("true");
      metricProperties.setCacheMaxSize(10000);
      MetricsPropertiesApi.storeProperties("hawkularGroup", metricProperties);
Annotate the the method that processes the metric you would like to monitor with the @Metric annotation :
            @Metric(fieldName = {"count"}, groupName = "hawkularGroup")
      public synchronized void getAndSetCountIncreased(Callable<Object> func) throws Exception {
           func.call();
      }
Then, deploy your application on a server that uses Hawkular Services, execute your code and you will see your metrics being monitored :
Application Metric Storage in Databases using JAM-Application-Metrics
JAM-Application-Metrics can be used to store the metrics in some Database, just by annotating the method of your ejb, or your injectable class in the general case, with the annotation @DBStore(groupName = "some name characteristic to the metric group", queryUpdateDB = {"the name of the query stored in the properties of the group","field name of the metric to be stored in the database"}, statementName = "the name of the statement that is stored in the group properties"). It is used in combination with the @Metric annotation. This is sufficient for the field-metrics to be stored in the database. An example of usage can be found under the folder ApplicationMetricsApiTest6. Start your DB Server and deploy the generated .war file on the Wildfly server to see the metrics being stored in the database.
For example, if we annotate the countMethod method below, with the annotations @Metric(fieldName = {"count"}, groupName="myTestGroup") and @DBStore(groupName = "myTestGroup", queryUpdateDB = {"StoreDBMetric","count"}, statementName = "statement_1"):
@Stateful
@LocalBean
public class MetricsApiSessionBean {

    private int count = 0;

    public MetricsApiSessionBean() {
    }

    @Metric(fieldName = {"count"}, groupName = "myTestGroup")
    @DBStore(groupName = "myTestGroup", queryUpdateDB = {"StoreDBMetric","count"}, statementName = "statement_1")  // Annotation that enables the storage of JBoss-Automated-Metrics in the database
    public int countMethod() {
        count++;

        return count;
    }

}
and we call the method countMethod one time :
public class PrintMetrics extends HttpServlet {

        @EJB
        private MetricsApiSessionBean metricsApiSessionBean;

        private String groupName = "myTestGroup";

        protected void processRequest(HttpServletRequest request, HttpServletResponse response)
                throws ServletException, IOException {
            response.setContentType("text/html;charset=UTF-8");
            initializeMetricProperties();

            try (PrintWriter out = response.getWriter()) {
                out.println("<!DOCTYPE html>");
                out.println("<html>");
                out.println("<head>");
                out.println("<title>Servlet PrintMetrics</title>");
                out.println("</head>");
                out.println("<body>");
                out.println("<h1>Servlet PrintMetrics : </h1>");
                metricsApiSessionBean.countMethod();
                out.println(MetricsCacheApi.printMetricsCache(groupName));
                out.println("<br>Successful Run ...</br>");
                out.println("</body>");
                out.println("</html>");
            }
       }

       private void initializeMetricProperties() {
            HashMap<String,String> rhqScheduleIds = new HashMap<String,String>();
            rhqScheduleIds.put("count", "11401");
            rhqScheduleIds.put("count2", "11402");
            MetricProperties metricProperties = new MetricProperties();
            metricProperties.setRhqMonitoring("false");
            metricProperties.setCacheStore("true");
            metricProperties.setRhqServerUrl("lz-panos-jon33.bc.jonqe.lab.eng.bos.redhat.com");
            metricProperties.setRhqScheduleIds(rhqScheduleIds);
            metricProperties.setDatabaseStore("true");  //Enable the database storage of metrics
            try {
                Connection  connection = DriverManager.getConnection("jdbc:mariadb://localhost:3306", "root", "panos");  //Create the DriverManager connection
                Statement stmt = connection.createStatement();
                createDbTable(stmt);   // Create the DB tables
                HashMap<String,Statement> dbStmt = new HashMap<String,Statement>();
                dbStmt.put("statement_1", stmt);
                metricProperties.setDatabaseStatement(dbStmt);   // Store the statement in the group properties
                HashMap<String,String> query1 = new HashMap<String,String>();
                query1.put("StoreDBMetric", "INSERT INTO MyMETRICS.metricValues(METRIC_NAME,METRIC_VALUE,METRIC_INSTANCE,RECORD_TIME) VALUES('{1}', [1], '{instance}', '{time}');");   //Store the sql query in the group properties
                                                           // sql query semantics :  {1} = Name of metric 1, [1] = Value of metric 1, {instance} = the instance of the class that contains the metric, {time} = the time of storage
                metricProperties.setUpdateDbQueries(query1);
            } catch(Exception e) {
                e.printStackTrace();
            }
            MetricsPropertiesApi.storeProperties(groupName, metricProperties);   //Store the group properties
        }

        private void createDbTable(Statement stmt) {
            try {
                String query = "SELECT COUNT(*) FROM information_schema.tables WHERE table_schema = 'MyMETRICS' AND table_name = 'metricValues'";
                ResultSet rs = stmt.executeQuery(query);
                rs.next();
                boolean exists = rs.getInt("COUNT(*)") > 0;

                if (!exists) {
                    String sql = "CREATE DATABASE MyMETRICS";   //Create the database
                    stmt.executeUpdate(sql);
                    System.out.println("Database created successfully...");

                    sql = "CREATE TABLE MyMETRICS.metricValues(ID int NOT NULL AUTO_INCREMENT, METRIC_NAME varchar(255) NOT NULL," +          //Create the tables
                          " METRIC_VALUE varchar(255) NOT NULL, METRIC_INSTANCE varchar(255), RECORD_TIME DATETIME, PRIMARY KEY(ID));";

                    stmt.executeUpdate(sql);
                }
            } catch(Exception e){
                e.printStackTrace();
            }
        }

                            .
                            .
                            .

    }
then the field-metric will be automatically stored in our metrics cache :
Metric Field Name : count (of instance org.jboss.metrics.MetricsApiSessionBean@43f98edf)
Value : 1
and in the database table MyMETRICS.metricValues :
ID METRIC_NAME METRIC_VALUE METRIC_INSTANCE RECORD_TIME
1 count 1 org.jboss.metrics.MetricsApiSessionBean@43f98edf 2015-07-30 16:01:35
JAM-Application-Metrics are now available as a Wildfly Subsystem Extension
How to install the JAM-Application-Metrics Wildfly extension :
- Go to the directory WildflyAddExtensionSubsystem/ApplicationMetricsSubsystemExtension (panossot/jam-metrics · GitHub) .
- Execute the maven command : mvn install -DJBossHome=The home directory of your Wildfly installation.
- Restart Wildfly server.
Record and Monitoring examples of Metrics using JAM-Application-Metrics
JAM-Application-Metrics can be used to record and monitor standard metrics, as JVM Memory Metrics and Free Disk Space Metrics. Such examples can be found in the folder StandardMetricsReadyForUsage (jam-metrics/StandardMetricsReadyForUsage at master · panossot/jam-metrics · GitHub).
JAM-Application-Metrics are now available using Java SE
JAM-Application-Metrics can be used to store the metrics in some Cache or Database and monitor them with Rhq, using Java SE. For this purpose, org.jboss.metrics.javase.applicationmetricsjavaseapi.JbossAupplicationJavaSeMetrics and org.jboss.metrics.javase.applicationmetricsjavaseapi.JbossApplicationJavaSeMetricsDbStore are used. An example of usage can be found under the folder ApplicationMetricsJavaSeApiTest2 (https://github.com/panossot/jboss-automated-metrics/tree/master/JavaSeApplicationMetrics/ApplicationMetricsJavaSeApiTest2).
For example, in class MetricsApiSeTestClass below, we use org.jboss.metrics.javase.applicationmetricsjavaseapi.JbossApplicationJavaSeMetrics for Cache Storage and Rhq Monitoring and org.jboss.metrics.javase.applicationmetricsjavaseapi.JbossApplicationJavaSeMetricsDbStore for Database Storage of metrics in Java SE:
public class MetricsApiSeTestClass {

    private int count = 0;

    private int count2 = 0;

    JbossAutomatedJavaSeMetrics jbMetrics;  // JBoss-Automated-Metrics Api class used for Cache Storage and Rhq Monitoring
    JbossAutomatedJavaSeMetricsDbStore jbMetricsDbStore;  // JBoss-Automated-Metrics Api class used for Database Storage

    public MetricsApiSeTestClass() {
        jbMetrics = new JbossAutomatedJavaSeMetrics();
        jbMetricsDbStore = new JbossAutomatedJavaSeMetricsDbStore();
    }

    public int countMethod() throws Exception {
        count++;
        count2 += 2;
        jbMetrics.metric(this,count,"count","myTestGroup");  // Used for Cache Storage and Rhq Monitoring of the metric "count"
                               // params : instance, metric value, metric name, group
        jbMetricsDbStore.metricsDbStore(this, new Object[]{count}, "myTestGroup", "statement_1", new String[]{"StoreDBMetric","count"});   // Used for Database Storage of the metric "count"
                                                         // params : instance, array of values used to replace sql query semantics [i], group, statement, sql query to be executed and strings to replace semantics {i}.
        jbMetrics.metric(this,count2,"count2","myTestGroup");   // Used for Cache Storage and Rhq Monitoring of the metric "count2"
        jbMetricsDbStore.metricsDbStore(this, new Object[]{count2}, "myTestGroup", "statement_1", new String[]{"StoreDBMetric","count2"});  // Used for Database Storage of the metric "count2"

        return count;
    }

}
and we call the method countMethod two sequential times :
public class AutomatedMetricsJavaSeApiTest {

    private static String groupName = "myTestGroup";

    /**
     * @param args the command line arguments
     */
    public static void main(String[] args) {
        try {
            initializeMetricProperties();
            MetricsApiSeTestClass mTC = new MetricsApiSeTestClass();
            mTC.countMethod();
            mTC.countMethod();
            System.out.println(MetricsCacheApi.printMetricsCache(groupName));
        } catch (Exception e) {
            e.printStackTrace();
        }
    }

    private static void initializeMetricProperties() {
        HashMap<String,String> rhqScheduleIds = new HashMap<String,String>();
        rhqScheduleIds.put("count", "11401");
        rhqScheduleIds.put("count2", "11402");
        MetricProperties metricProperties = new MetricProperties();
        metricProperties.setRhqMonitoring("true");  // Enable Rhq monitoring
        metricProperties.setCacheStore("true");  // Enable Cache Storage
        metricProperties.setRhqServerUrl("lz-panos-jon33.bc.jonqe.lab.eng.bos.redhat.com");
        metricProperties.setRhqScheduleIds(rhqScheduleIds);
        metricProperties.setDatabaseStore("true");  // Enable Database Storage
        try {
            Connection  connection = DriverManager.getConnection("jdbc:mariadb://localhost:3306", "root", "panos");
            Statement stmt = connection.createStatement();
            createDbTable(stmt);
            HashMap<String,Statement> dbStmt = new HashMap<String,Statement>();
            dbStmt.put("statement_1", stmt);
            metricProperties.setDatabaseStatement(dbStmt);
            HashMap<String,String> query1 = new HashMap<String,String>();
            query1.put("StoreDBMetric", "INSERT INTO MyMETRICS.metricValues(METRIC_NAME,METRIC_VALUE,METRIC_INSTANCE,RECORD_TIME) VALUES('{1}', [1], '{instance}', '{time}');");
                             // sql query semantics :  {1} = Name of metric 1, [1] = Value of metric 1, {instance} = the instance of the class that contains the metric, {time} = the time of storage
            metricProperties.setUpdateDbQueries(query1);
        } catch(Exception e) {
            e.printStackTrace();
        }
        MetricsPropertiesApi.storeProperties(groupName, metricProperties);
    }

    private static void createDbTable(Statement stmt) {
        try {
            String query = "SELECT COUNT(*) FROM information_schema.tables WHERE table_schema = 'MyMETRICS' AND table_name = 'metricValues'";
            ResultSet rs = stmt.executeQuery(query);
            rs.next();
            boolean exists = rs.getInt("COUNT(*)") > 0;

            if (!exists) {
                String sql = "CREATE DATABASE MyMETRICS";
                stmt.executeUpdate(sql);
                System.out.println("Database created successfully...");

                sql = "CREATE TABLE MyMETRICS.metricValues(ID int NOT NULL AUTO_INCREMENT, METRIC_NAME varchar(255) NOT NULL," +
                      " METRIC_VALUE varchar(255) NOT NULL, METRIC_INSTANCE varchar(255), RECORD_TIME DATETIME, PRIMARY KEY(ID));";

                stmt.executeUpdate(sql);
            }
        } catch(Exception e){
            e.printStackTrace();
        }
    }
}
then the field-metrics will be automatically stored in our metrics cache :
Metric Field Name : count (of instance org.jboss.metrics.applicationmetricsjavaseapitest.MetricsApiSeTestClass@47f92qcf)
Value : 1
Value : 2
Metric Field Name : count2 (of instance org.jboss.metrics.applicationmetricsjavaseapitest.MetricsApiSeTestClass@47f92qcf)
Value : 2
Value : 4
and in the database table MyMETRICS.metricValues :
ID METRIC_NAME METRIC_VALUE METRIC_INSTANCE RECORD_TIME
1 count 1 org.jboss.metrics..applicationmetricsjavaseapitest.MetricsApiSeTestClass@47f92qcf 2015-07-30 16:08:15
2 count2 2 org.jboss.metrics..applicationmetricsjavaseapitest.MetricsApiSeTestClass@47f92qcf 2015-07-30 16:08:15
3 count 2 org.jboss.metrics..applicationmetricsjavaseapitest.MetricsApiSeTestClass@47f92qcf 2015-07-30 16:08:15
4 count2 4 org.jboss.metrics..applicationmetricsjavaseapitest.MetricsApiSeTestClass@47f92qcf 2015-07-30 16:08:15
The metrics are also monitored using RHQ.
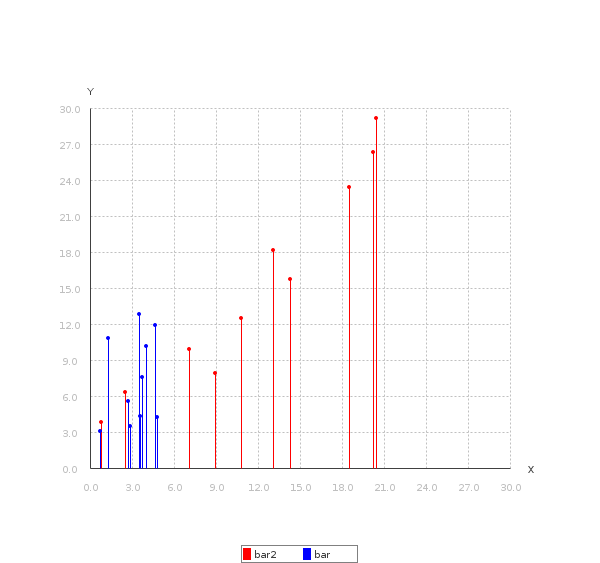
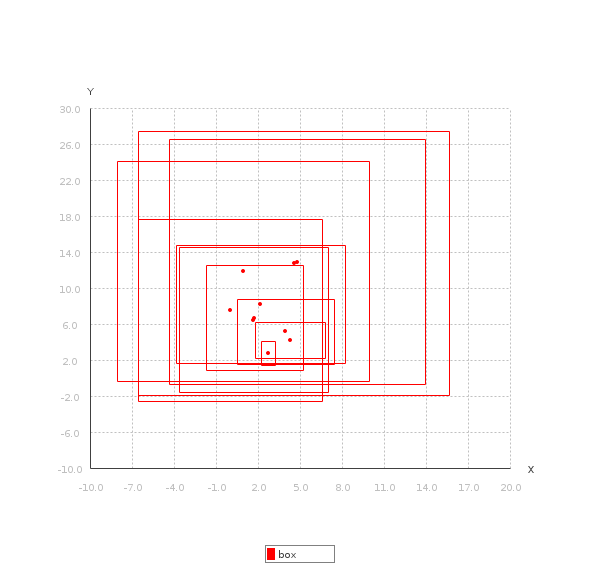
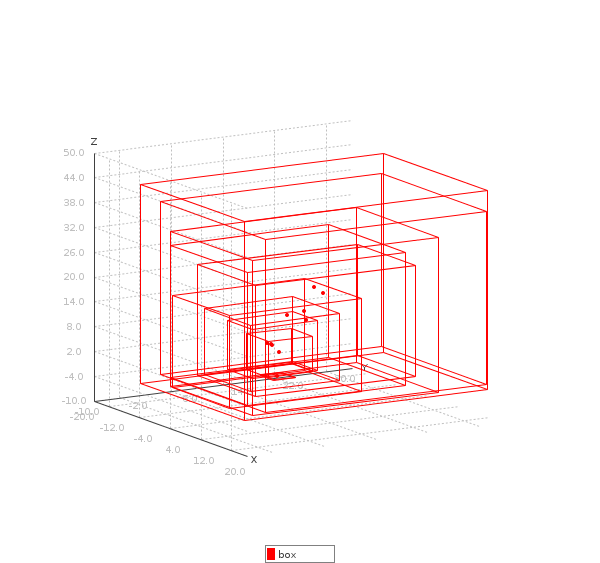
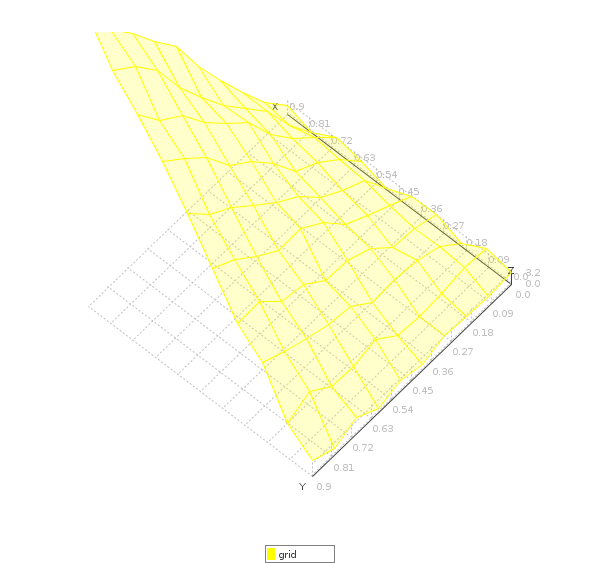
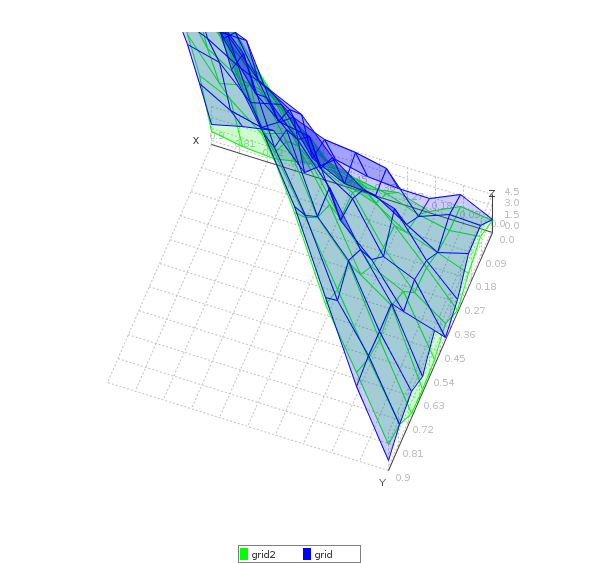
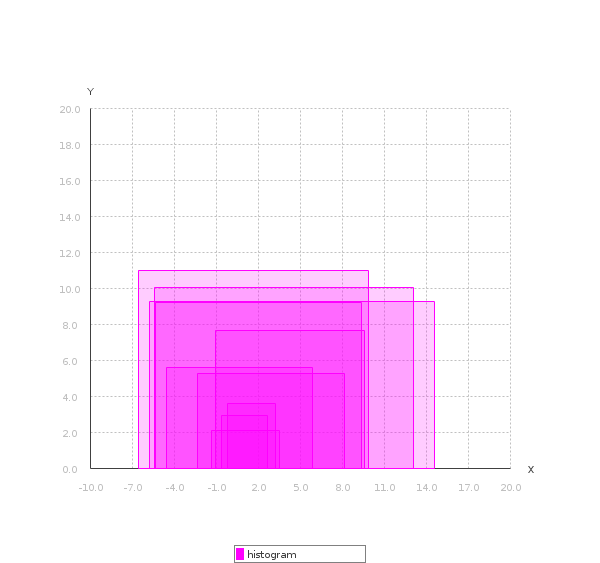
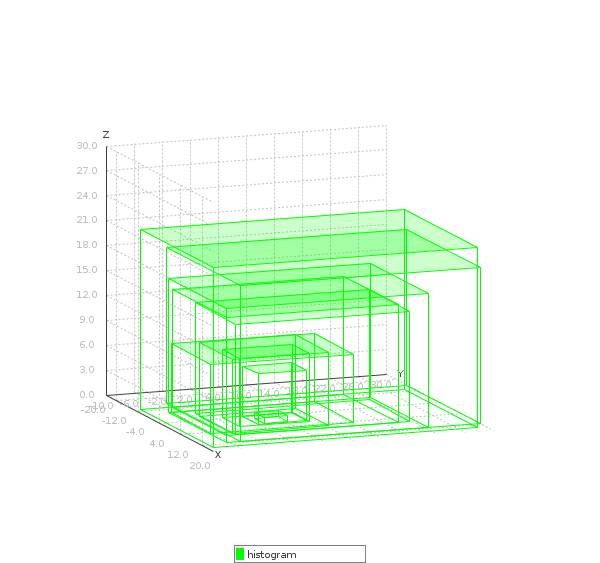
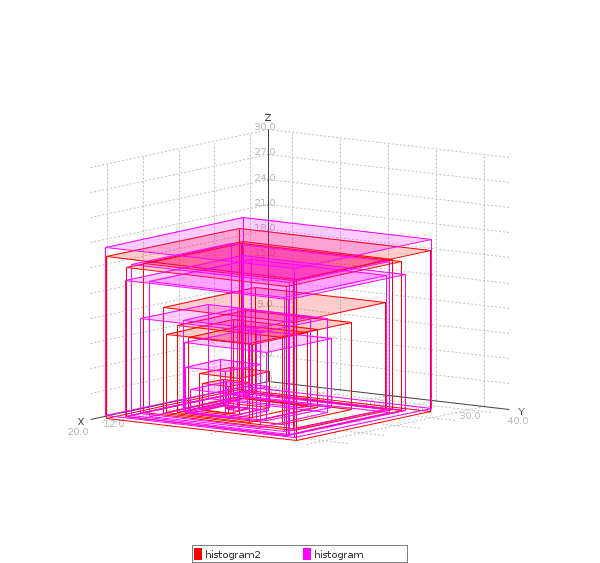
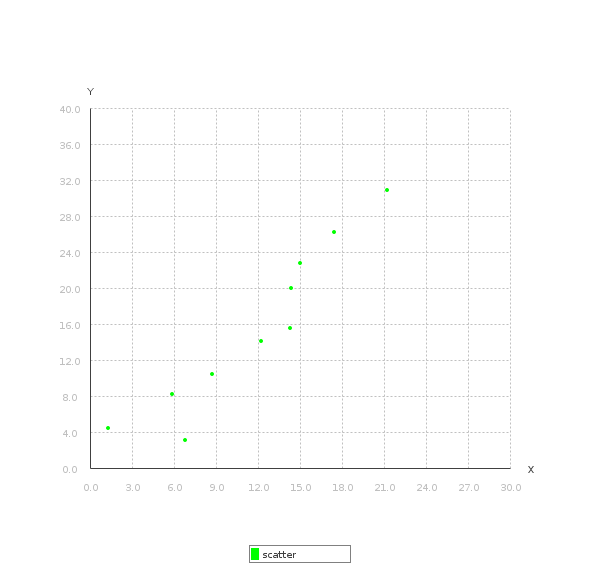
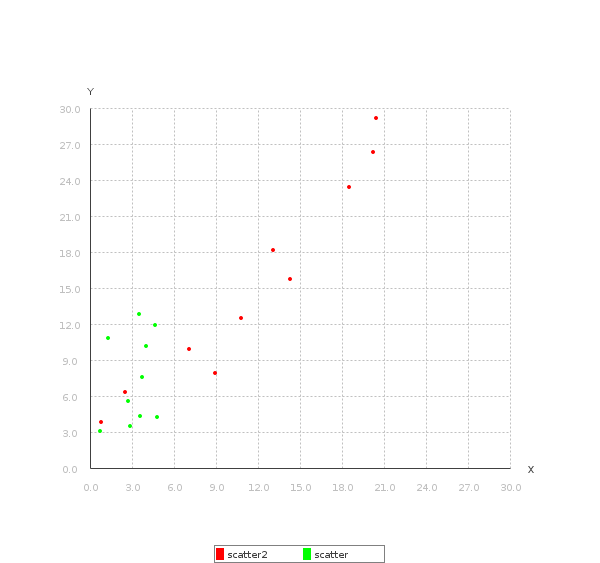
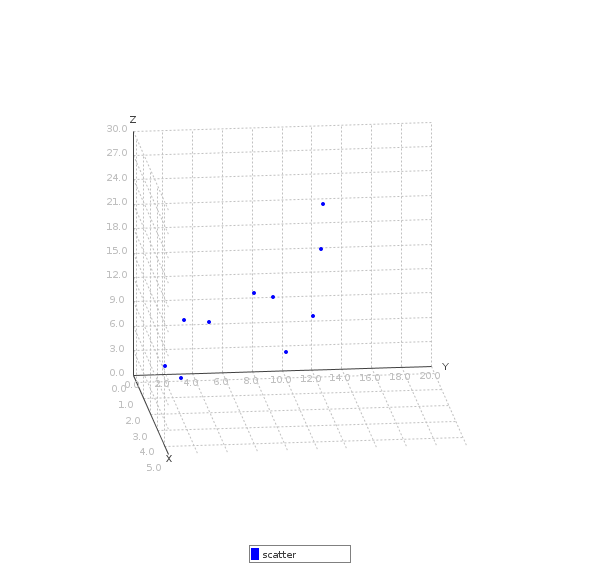
JAM-Application-Metrics plots
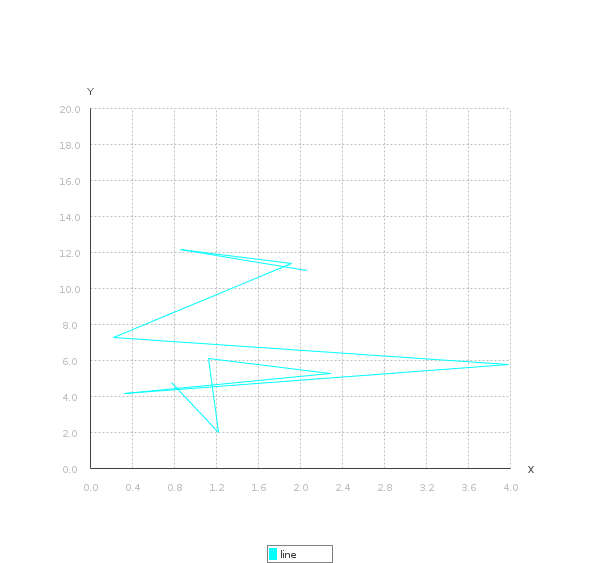
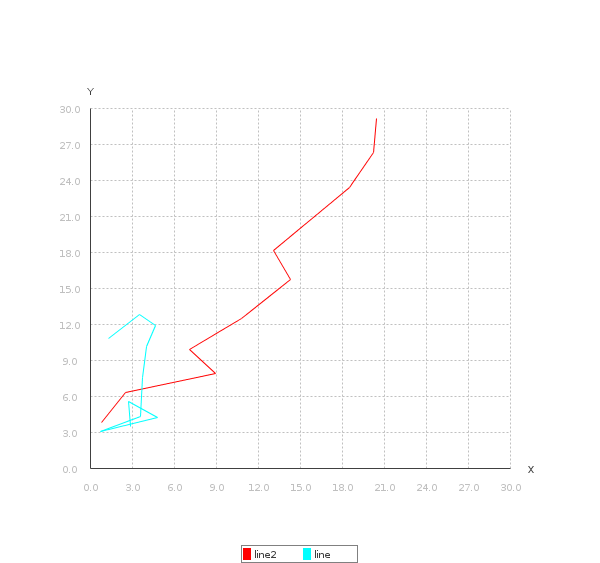
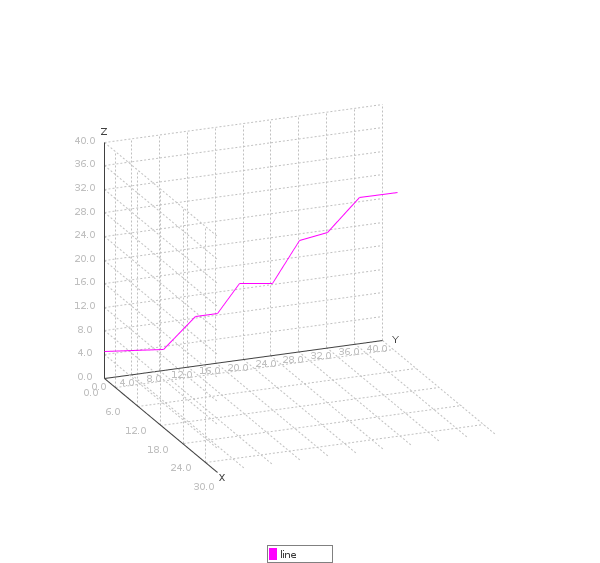
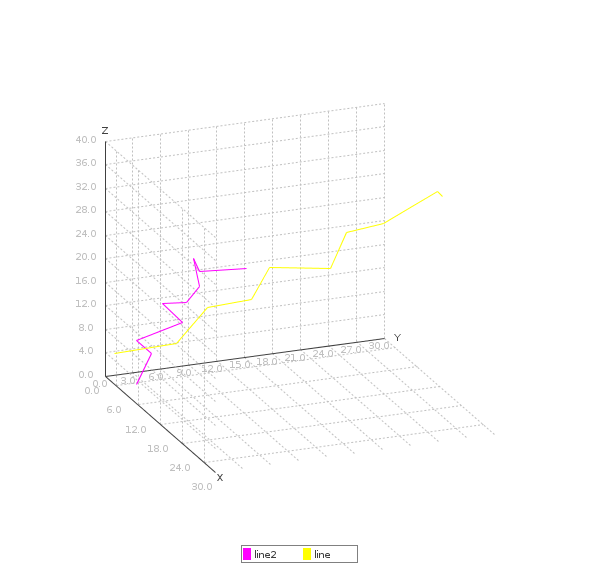
JAM-Application-Metrics provide the choice of plotting the metrics using line, bar or scatter 2-D plots and 3-D plots. Please, check the relative example on github (ApplicationMetricsApiTest7 , ApplicationMetricsApiTest17 , ApplicationMetricsApiTest18 , ApplicationMetricsApiTest19 , ApplicationMetricsApiTest20) to see how JAM-Application-Metrics can be plotted.
| 2D and 3D Metric Plots | ||
|---|---|---|
 |  |  |
 |  |  |
 |  |  |
 |  |  |
 |  |  |
 |  |  |
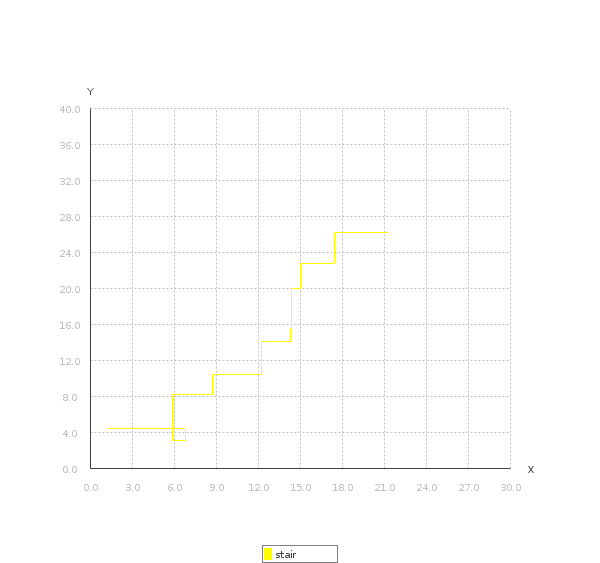 |  |
Line plot
The code can be found under panossot/jam-metrics · GitHub .
FUTURE EXTENSIONS
- Extend JAM-Application-Metrics to be monitored with Hawkular
- Work as a subsystem of Wildfly (Wildfly could contribute in Sciences - simulations, etc) --Implemented--
- Extend JAM-Application-Metrics to send and store the metrics in any database --Implemented--
- Extend JAM-Application-Metrics to be displayed in the web console
- Create standard metrics, ready for use
- Open Source Analytics
LATEST NEWS
- JBoss-Automated-Metrics Wildfly Standalone version 1.0.0.Final is released!!! Search for org.jboss.metrics in The Central Maven Repo.
- JBoss-Automated-Metrics Java SE version 1.0.0.Final is released!!!
- JBoss-Automated-Metrics Wildfly Standalone version 1.0.1.Final is released!!! (Minor synchronization fixes)
- JBoss-Automated-Metrics Java SE version 1.0.1.Final is released!!! (Minor synchronization fixes)
- JBoss-Automated-Metrics Wildfly Standalone version 1.0.2.Final is released!!! (More Stable, More asynchronous, Parametrized cache storage size, Send array of data to RHQ, etc)
- JBoss-Automated-Metrics Java SE version 1.0.2.Final is released!!! (More Stable, More asynchronous, Parametrized cache storage size, Send array of data to RHQ, etc)
- JBoss-Automated-Metrics Wildfly Standalone version 1.0.3.Final is released!!! (Synchronous and asynchronous @DBStore functions, independent @Metric and @DBStore functions, addition of capability to store more parameters (other than the metrics) using @DBStore, addition of capability to execute a batch of queries using @DBStore, addition of code-enablement capability, development of integration tests which proove the functionalities, renaming of the artifacts , etc)
- JBoss-Automated-Metrics Java SE version 1.0.3.Final is released!!!(Synchronous and asynchronous DBStore functions, independent Metric and DBStore functions, addition of capability to store more parameters (other than the metrics) using DBStore, addition of capability to execute a batch of queries using DBStore, addition of code-enablement capability, development of integration tests which proove the functionalities, renaming of the artifacts , etc)
Comments