This page may be obsolete.
Generate a thread dump using JMX Console
In order to generate a thread dump:
1. Open the JMXConsole (for example: http://localhost:8080 )
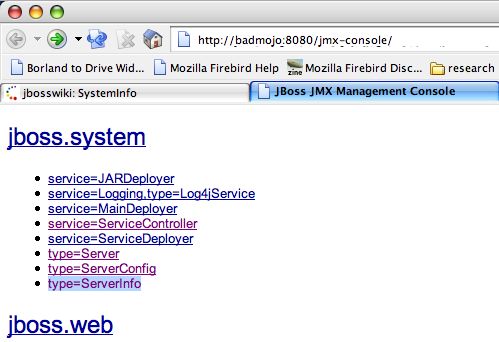
2. Navigate to jboss.system:type=ServerInfo mbean (hint: you can probably just CTRL-F and enter type=ServerInfo in the dialog box)
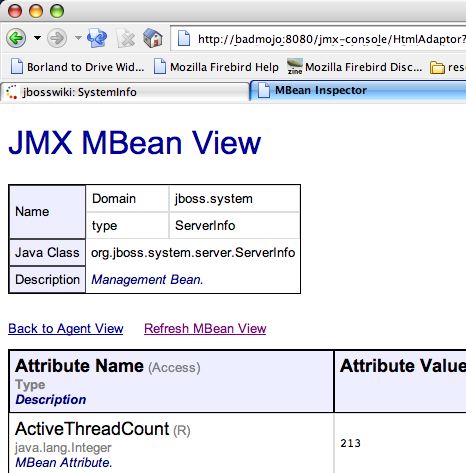
3. Click on the link for the Server Info mbean.
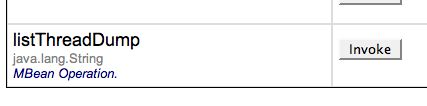
4. Navigate to the bottom where it says "listThreadDump"
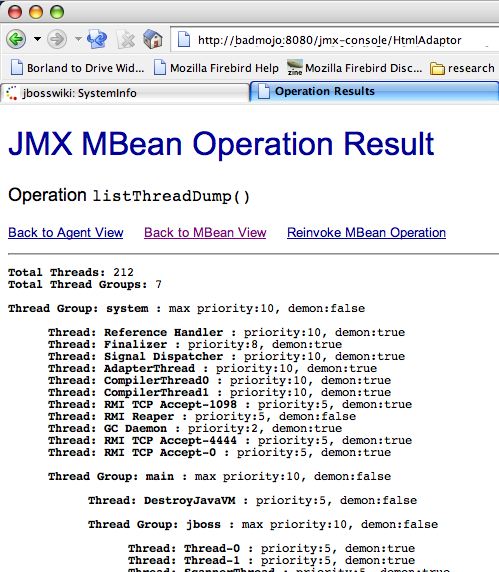
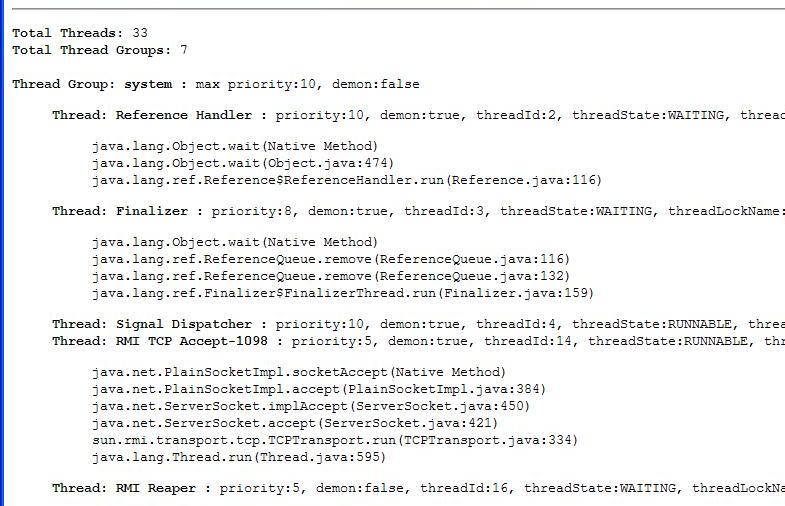
5. Click it and get your thread dump
6. Enjoy your thread dump (and/or debug your problem, send it up to JBoss support or attach it to your bug report)
Notes:
If you are using Internet Explorer you should use File -> Save As to save the output instead of copying the data to a text editor. For some reason when you copy the text from Internet Explorer the line breaks are not copied and all of the output ends up on a single line.
Generate a Thread Dump using Twiddle
Alternatively you can use twiddle to execute the listThreadDump method and pipe the returned HTML directly to file i.e.
<JBOSS_HOME>/bin/twiddle invoke "jboss.system:type=ServerInfo" listThreadDump > threads.html
-
Update for JBoss v3.2.8/4.0.2 - when running under JDK5 additional information is printed for each thread (id, state, lockName, and a full StackTrace)

-
Also See: Generating a thread dump without the console
-
Referenced by:
Comments