With RichFaces 4.5.0 comes a new component for rendering charts, built on the Flot JavaScript library (www.flotcharts.org).
Chart
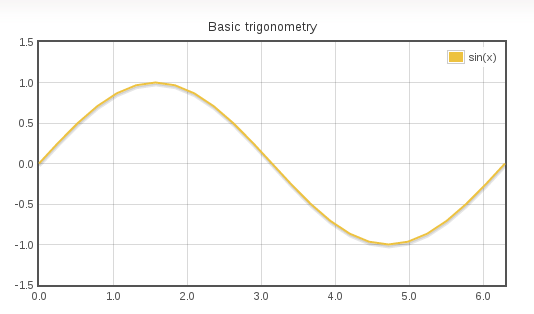
A simple chart can be created like this:
<rich:chart title="Basic trigonometry">
    <rich:chartSeries label="sin(x)" type="line">
        <a4j:repeat value="#{sineBean.sinX}" var="point">
            <rich:chartPoint x="#{point.x}" y="#{point.y}" />
        </a4j:repeat>
    </rich:chartSeries>
</rich:chart>
NOTE: The naming of chart-related components was changed in 4.5.0.CR1, if you've already started using the chart component you will need to change the tags.
rich:chart
besides the standard the attributes like id, style or rendered also enables event handling (more below)
rich:chartSeries
sets the type of the chart (line, bar or pie) and a label, it can also be used set the color for the series and the style of the points.
rich:chartPoint
defines the "x" and "y" values of a point in the series.
A single chart can contain more than one series:
<rich:chart title="More basic trigonometry">
    <rich:chartSeries label="sin(x)" type="line" symbol="circle" color="blue">
        <a4j:repeat value="#{sineBean.sinX}" var="point">
            <rich:chartPoint x="#{point.x}" y="#{point.y}" />
        </a4j:repeat>
    </rich:chartSeries>
    <rich:chartSeries label="2*sin(x)" type="line" symbol="square" color="red">
        <a4j:repeat value="#{sineBean.twoSinX}" var="point">
            <rich:chartPoint x="#{point.x}" y="#{point.y}" />
        </a4j:repeat>
    </rich:chartSeries>
    <rich:chartSeries label="cos(2*x)" type="line" symbol="diamond" color="green">
        <a4j:repeat value="#{sineBean.cosTwoX}" var="point">
            <rich:chartPoint x="#{point.x}" y="#{point.y}" />
        </a4j:repeat>
    </rich:chartSeries>
</rich:chart>

There are three more tags that can be included in rich:chart to further customize the chart's appearance:
rich:chartLegend
can be used to specify the position of the legend and ordering of the labels
<rich:chartLegend position="sw" sorting="ascending" />
rich:chartXAxis and rich:chartYAxis
can be used to specify minimum and maximum values or labels of the axes, and also to insert padding (whitespace) on the ends of an axis
<rich:chartXAxis label="Relevant months" min="2" max="9" />
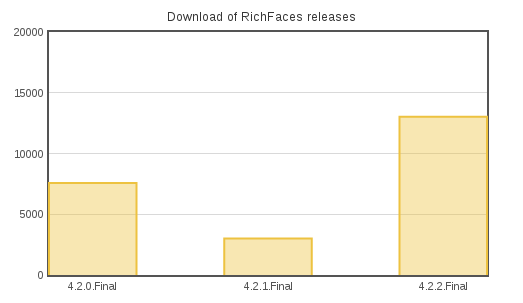
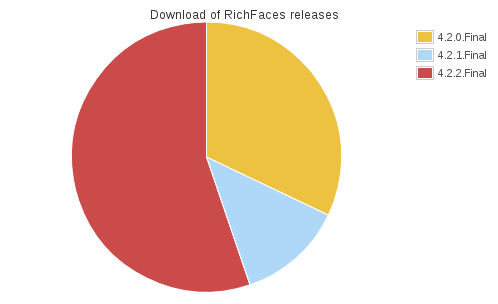
Chart Types
Besides line charts the component can also render bar and pie charts (defined by type attribute of chartSeries, line and bar series can be combined in a single chart):
Event handling
Chart offers two custom events that can be listened to:
plothover
triggers when mouse is hovered over the chart
plotclick
triggers when a part of the chart is clicked (a bar, a slice or a point)
The event listeners (onplothover, onplotclick) can be defined for the whole chart or separately for each series.