Not only beginners sometimes struggle with the complexity of CDI. Simple cases are just simple but when it comes to more advanced topics one can easily become frustrated. Luckily some of the problems are solved by IDEs like JBoss Developer Studio. However, there are questions the static analysis simply can't answer.
Introducing the Probe
Weld 3.0.0.Alpha4 has a new feature - the development mode. When enabled, certain built-in development tools are available. The first tool which could facilitate the development of CDI applications is Weld Probe. It allows developers to inspect the application components at runtime. What exactly is it good for? If you ever asked a question similar to the following ones, it's the right tool for you:
- What bean archives are there in my app?
- How many extensions do affect my app?
- What's the final set of beans in my app?
- What are the real dependencies of my bean?
- What beans are involved in a particular bean invocation?
- In which bean archive is this interceptor/decorator enabled?
No Replacement For Debugger
Note that the point is not to replace tools such as debugger or profiler. It's more about understanding the application.
Get Started
The Probe consists of the REST API and the default (single-page application) client. Therefore it's only available in a web application. Right now, the integration is provided for WildFly (unofficial patch), Tomcat and Jetty (Weld Servlet). To enable the development mode just set the servlet initialization parameter org.jboss.weld.development to true:
<web-app version="3.1" xmlns="http://xmlns.jcp.org/xml/ns/javaee/"
xmlns:xsi="http://www.w3.org/2001/XMLSchema-instance"
xsi:schemaLocation="http://xmlns.jcp.org/xml/ns/javaee http://xmlns.jcp.org/xml/ns/javaee/web-app_3_1.xsd">

    <context-param>
        <param-name>org.jboss.weld.development</param-name>
        <param-value>true</param-value>
    </context-param>

</web-app>
Once the development mode is enabled the Probe is automatically activated. The default client is available at path /weld-probe inside your web application, e.g. http://localhost:8080/weld-numberguess/weld-probe.
Default Client
Let's go through the default client and desribe the basic functionality available.
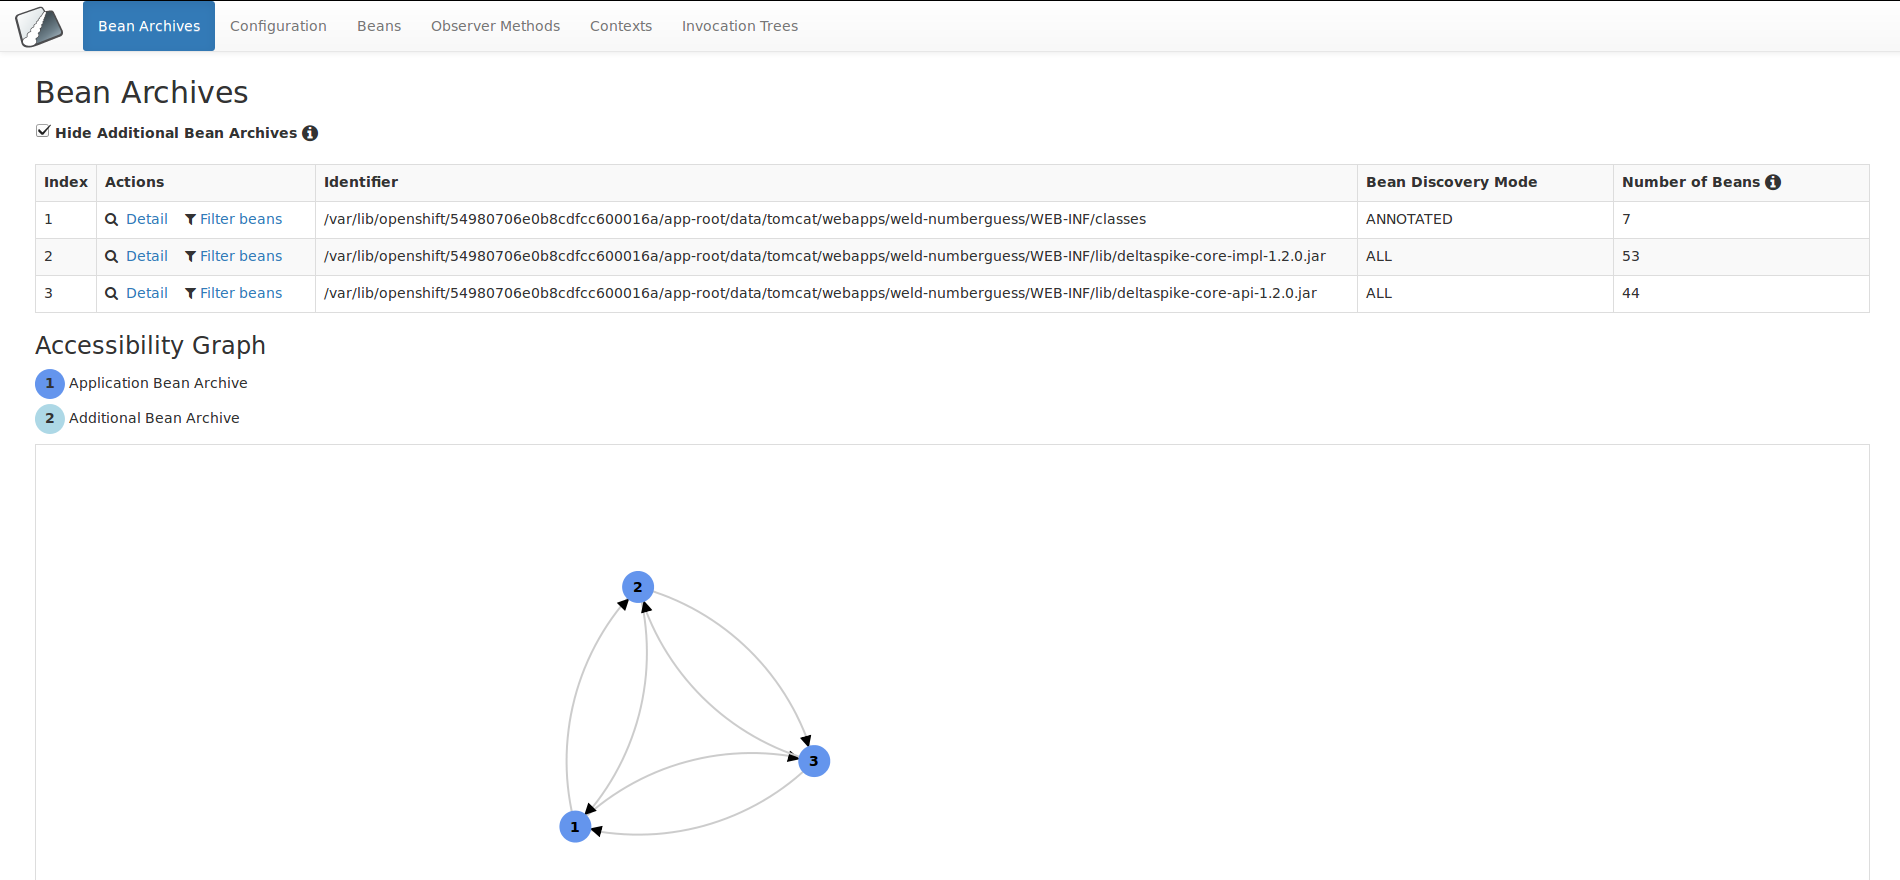
Bean Archives
This view shows all the bean archives in your application. The accessibility graph might be useful for complicated deployments. Note that additional bean archives (synthetic bean archives created for beans and extensions which do not belong to any regular bean archive) are hidden by default.
Weld Configuration
Look through the Weld configuration properties and their final values (see also Weld Configuration).
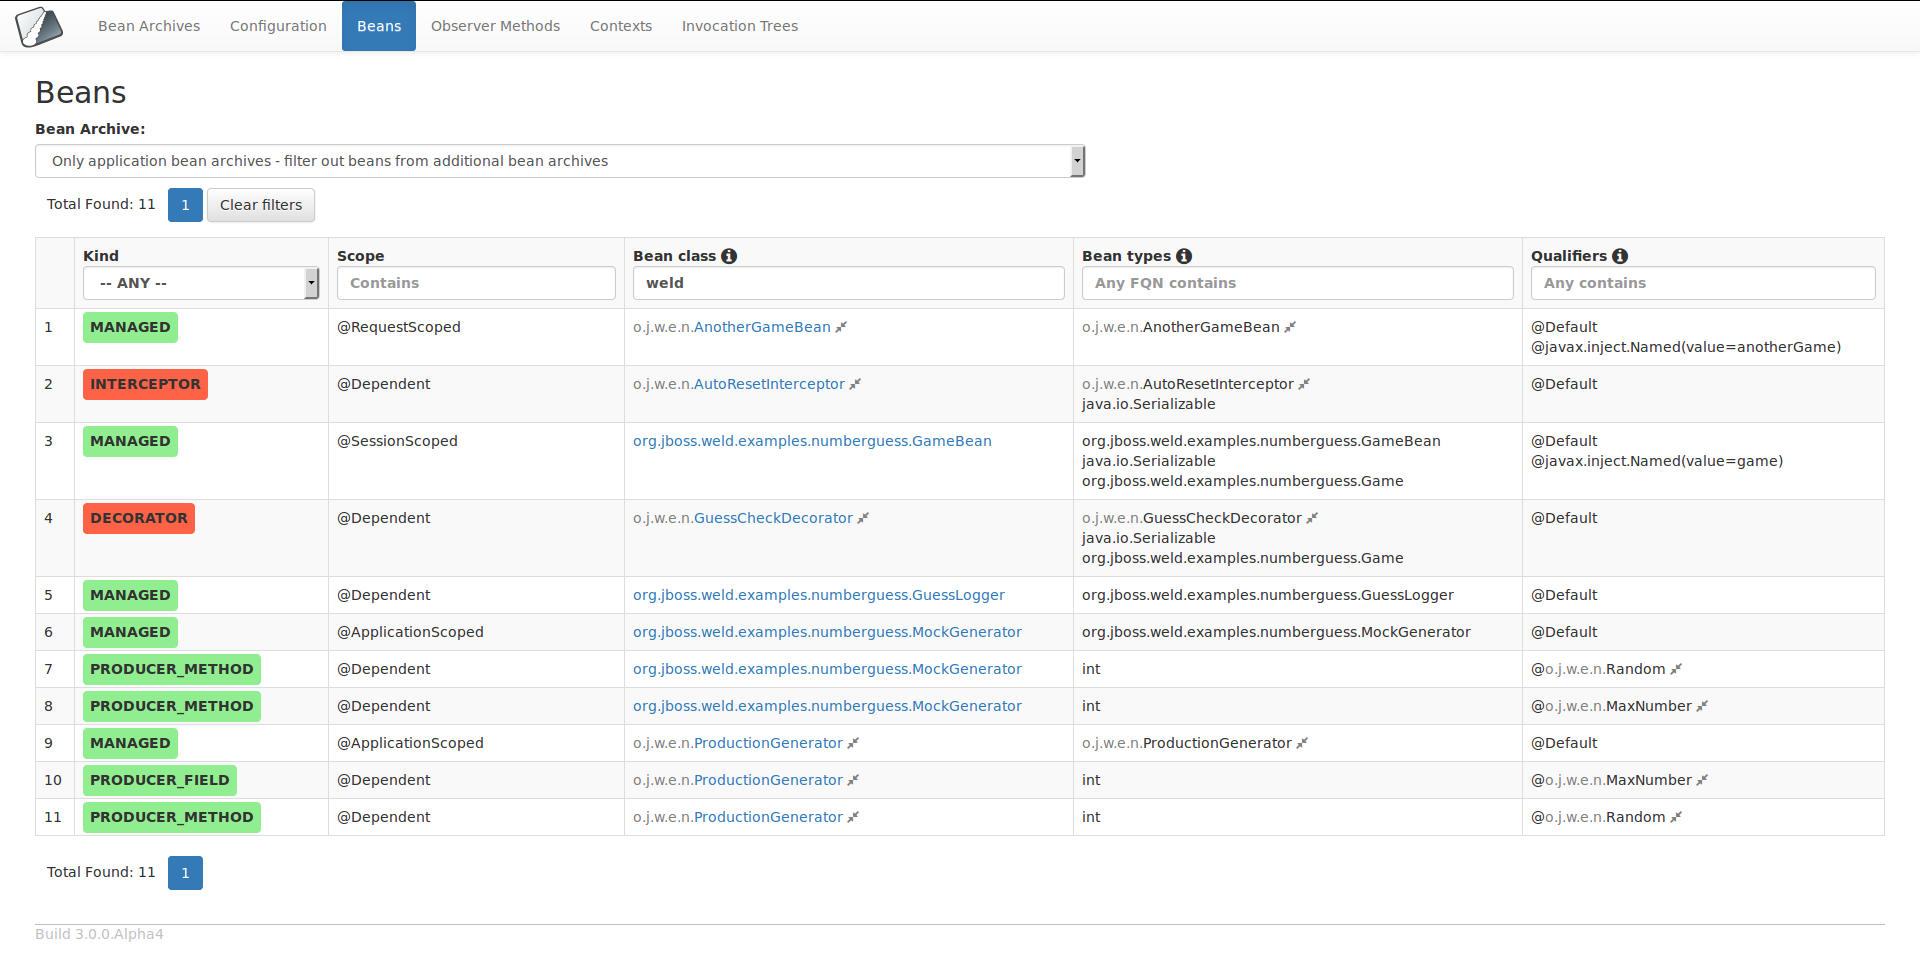
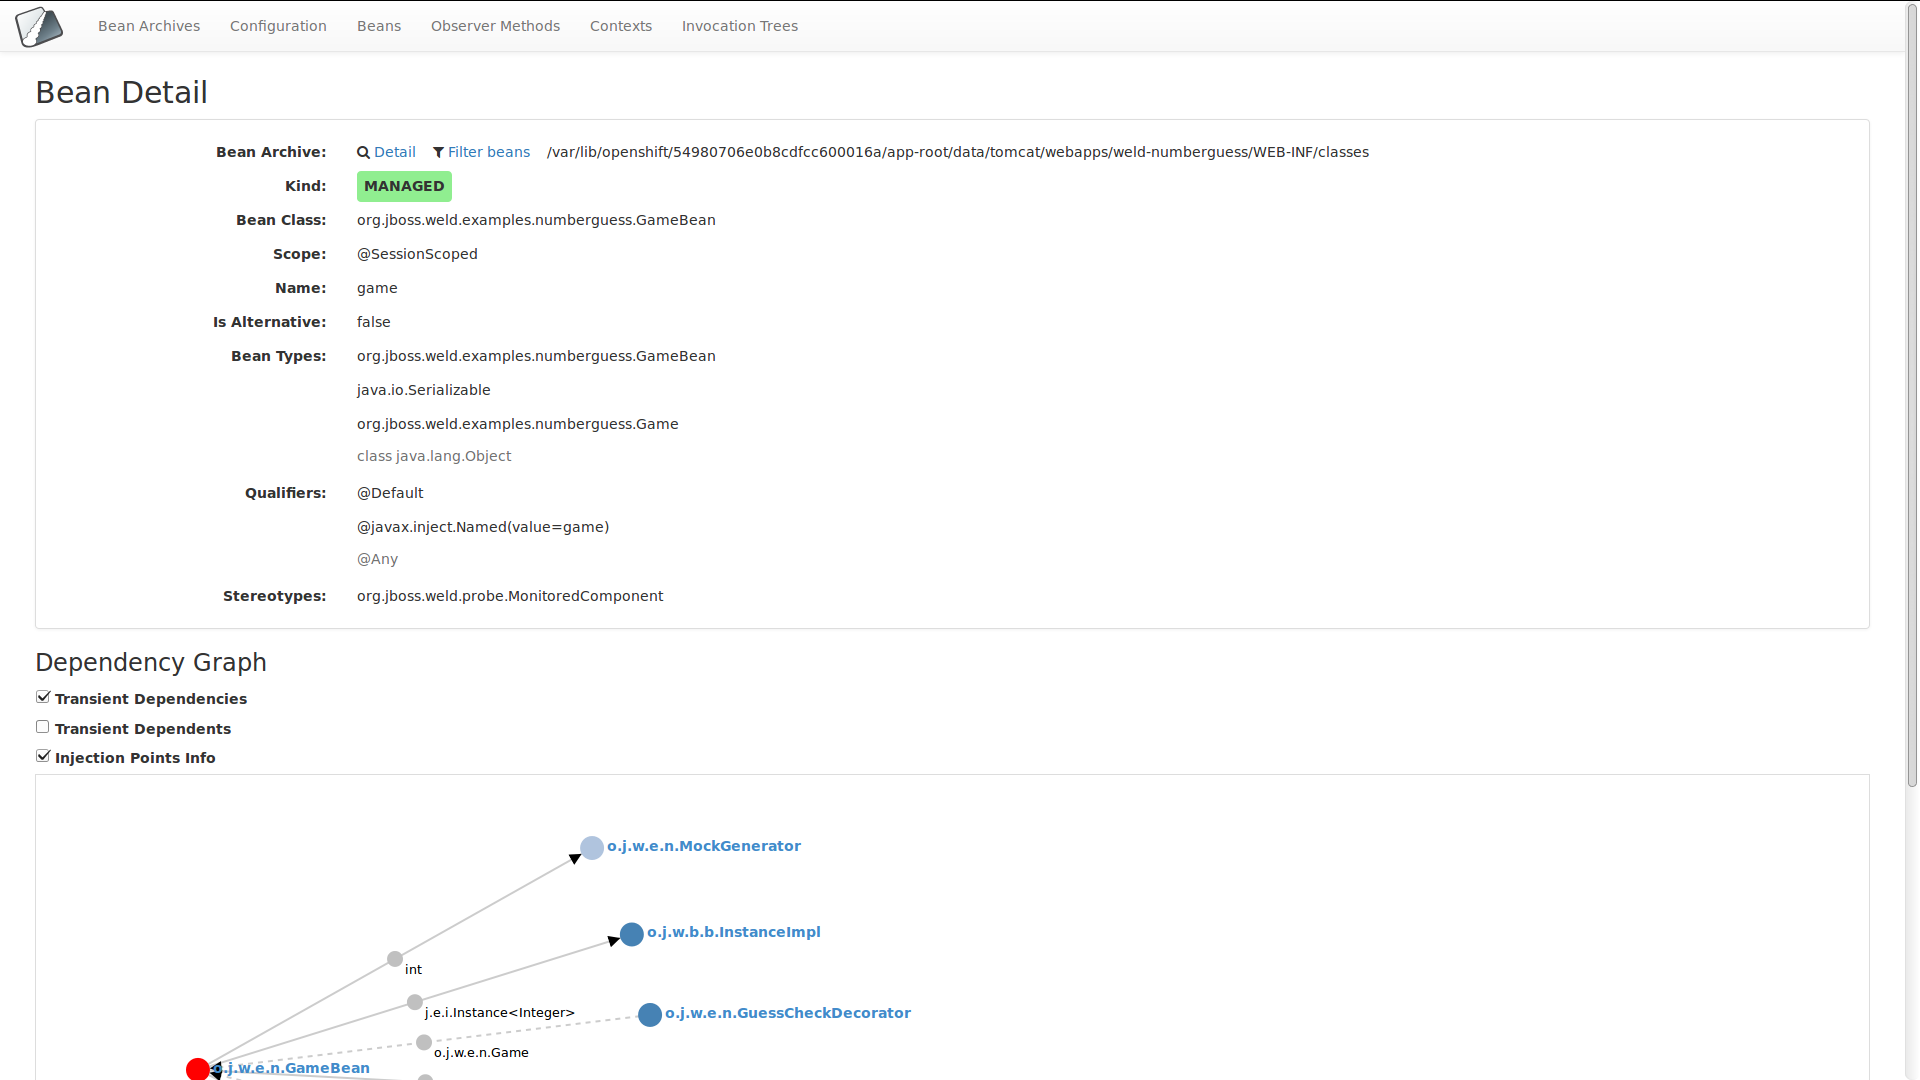
Beans
This view shows all the beans Weld is aware of. Note that built-in beans and Java EE integration stuff (e.g. for JSR 352: Batch Applications for the Java Platform) is shown as well. However, you can use various filters to find the beans you're interested in. The bean detail shows all important attributes, declared observers and producers, declaring bean for producers, and also dependencies and dependents.
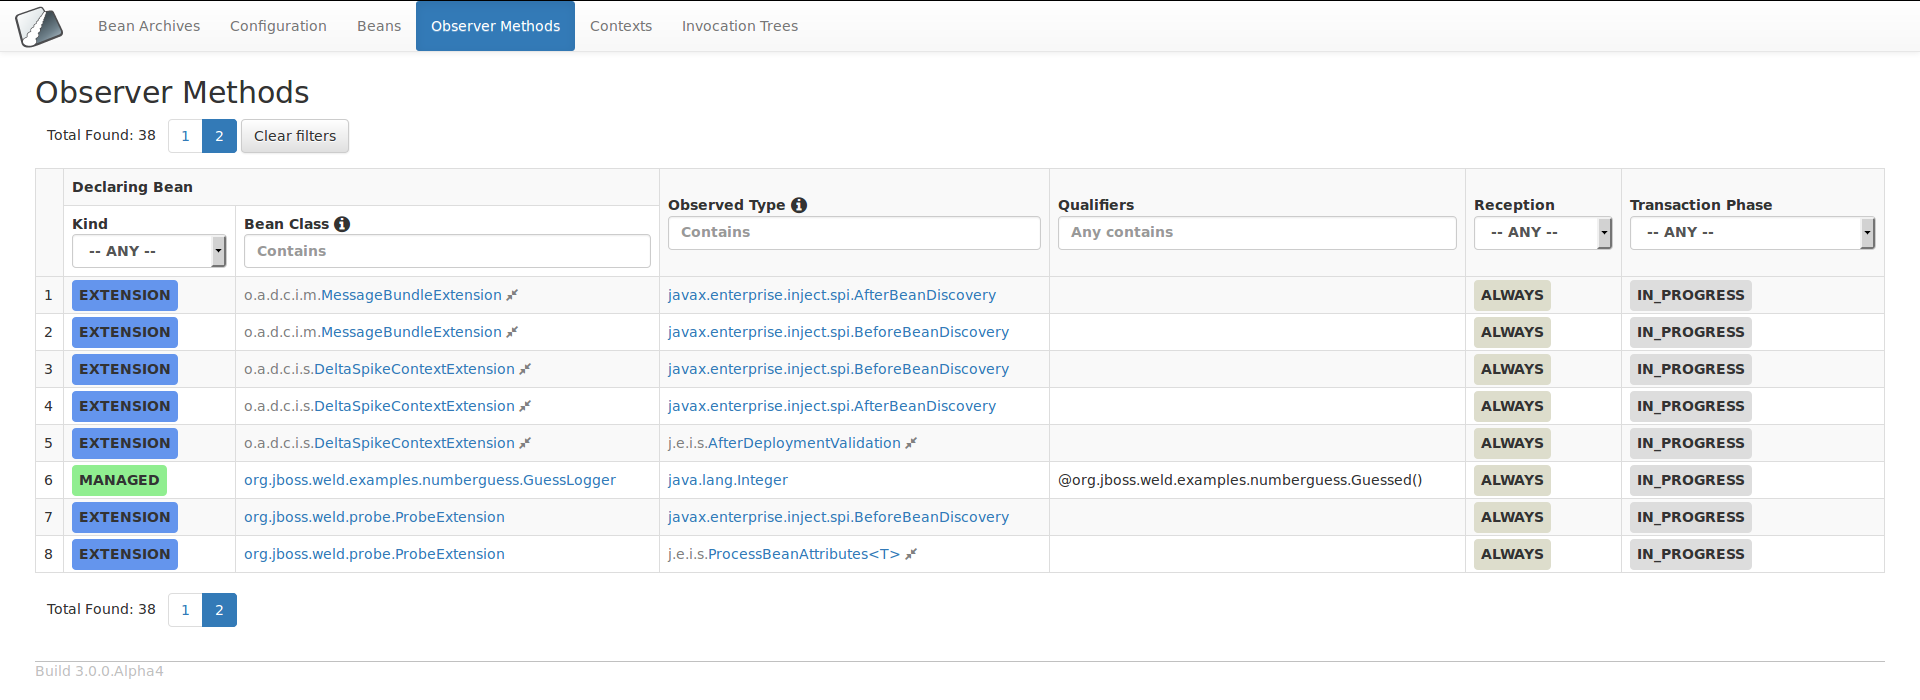
Observer Methods
Discover all the registered observer methods, even those declared on extensions.
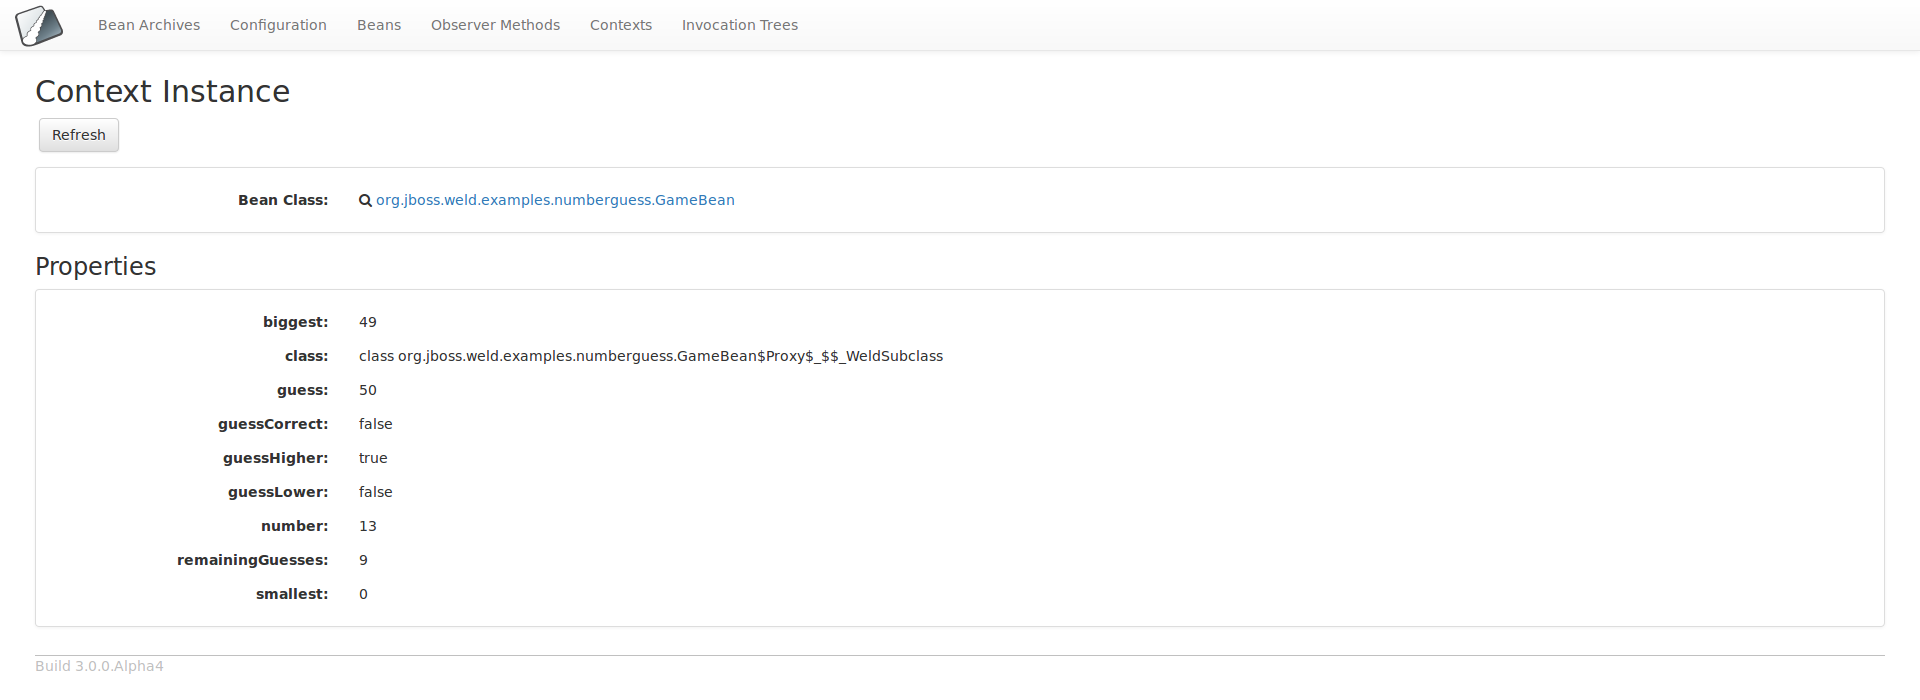
Contexts
Do you remember the The Seam Debug Page? The purpose of this view is very similar - to inspect the bean instances in application and session contexts. There is a plan to support the Conversation context as well.
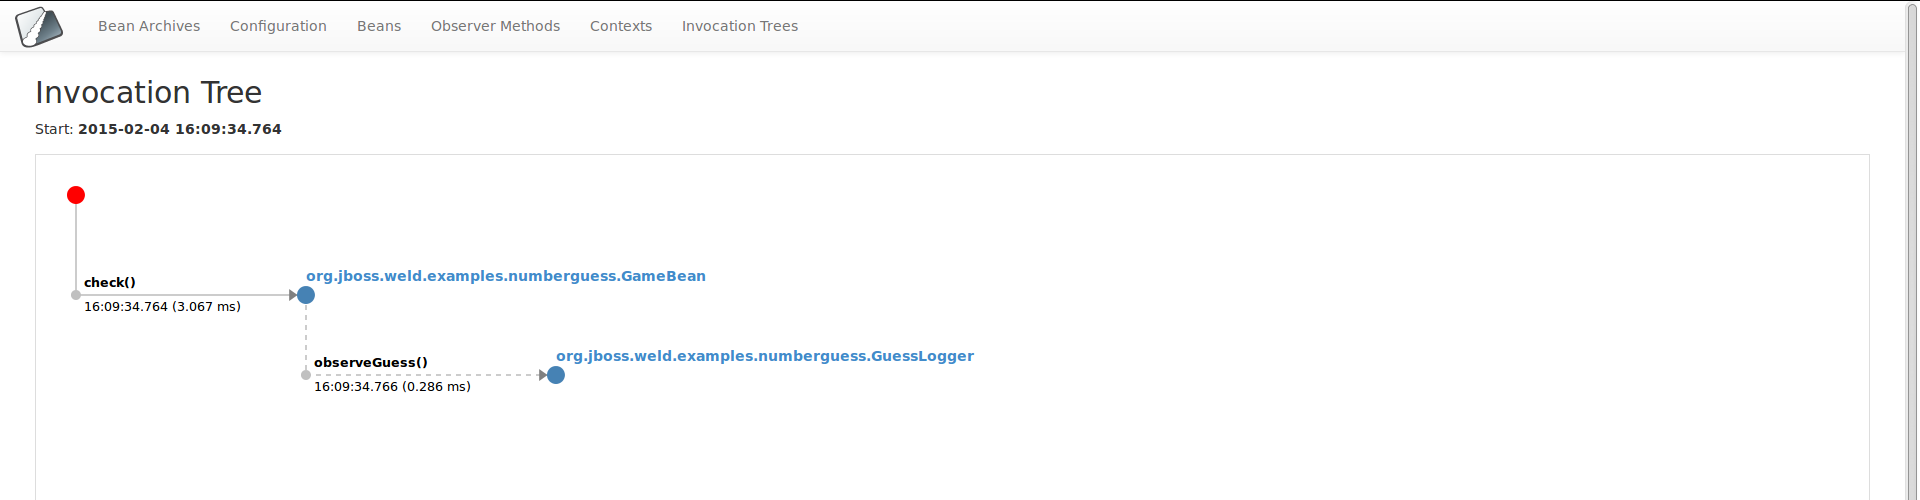
Invocation Trees
Sometimes it's useful to know what happens if a certain bean instance is called. The invocation tree shows all invocations within the given entry point. Where the entry point is the first business method invocation captured by the monitor in a certain thread. There is a plan to group invocations involved in a particular HTTP request.
Future and Plans
Weld Probe is still work in progress and we're working on new features, e.g. Fired Events log. Moreover, we're also considering whether it's worth backporting into Weld 2.2.x.
A slightly modified numberguess example with the development mode enabled is available at: http://probe-weld.itos.redhat.com/weld-numberguess. And the default client: http://probe-weld.itos.redhat.com/weld-numberguess/weld-probe.
Give it a try and let us know. There is a "Development Tools (Probe)" JIRA component to track down probe-related issues. Your feedback is highly appreciated!