9 Replies Latest reply on Apr 28, 2011 4:32 AM by bushurui

    JBoss performance decrease

    bushurui

      Hi,all

      When I doing a load testing job about JBossperformance/throughput of my JBossAS,

      I find that the performance will decreasewith time increase.

      So I want to find out what make it like this.Here is my test report.


      1.Testing environment:


      JBoss version:JBoss5.1.0.GA

      Java version:JDK1.5

      OS:Windows server 2003

      DBMS:Sql server 2005

      Testing tool: Apache Jmeter/i have set 50threads and Ramp-Up Period in 30 seconds.


      2.I’ve done some JBoss tuning. Here aresome tune changes in my test JBoss.


      a)I’ve add some parameters about JVM in thefile %JBOSS_HOME%bin\run.conf.bat


      rem # JVM memory allocation pool parameters- modify as appropriate.

      set "JAVA_OPTS=-Xms1024M -Xmx1024M-XX:MaxPermSize=256M -XX:NewSize=400M -XX:MaxNewSize=400M-XX:SurvivorRatio=32"


      rem #

      set -Djava.util.logging.manager=java.util.logging.LogManager-Djava.util.logging.config.file=C:\mcs\config\logging.properties"


      b)Here is the logging.properties:

      ##########################################################

      #    Default Logging Configuration File

      #

      # You can use a different file byspecifying a filename

      # with the java.util.logging.config.filesystem property. 

      # For example java-Djava.util.logging.config.file=myfile

      ############################################################


      ############################################################

      #    Global properties

      ############################################################


      # "handlers" specifies a commaseparated list of log Handler

      # classes. These handlers will be installed during VM startup.

      # Note that these classes must be on thesystem classpath.

      # By default we only configure aConsoleHandler, which will only

      # show messages at the INFO and abovelevels.

      handlers= java.util.logging.ConsoleHandler


      # To also add the FileHandler, use thefollowing line instead.

      #handlers= java.util.logging.FileHandler,java.util.logging.ConsoleHandler


      # Default global logging level.

      # This specifies which kinds of events arelogged across

      # all loggers.  For any given facility this global level

      # can be overriden by a facility specificlevel

      # Note that the ConsoleHandler also has aseparate level

      # setting to limit messages printed to theconsole.

      .level= OFF


      ############################################################

      # Handler specific properties.

      # Describes specific configuration info forHandlers.

      ############################################################


      # default file output is in user's homedirectory.

      java.util.logging.FileHandler.pattern =%h/java%u.log

      java.util.logging.FileHandler.limit = 50000

      java.util.logging.FileHandler.count = 1

      java.util.logging.FileHandler.formatter =java.util.logging.XMLFormatter


      # Limit the message that are printed on theconsole to INFO and above.

      java.util.logging.ConsoleHandler.level =OFF

      java.util.logging.ConsoleHandler.formatter= java.util.logging.SimpleFormatter


      ############################################################

      # Facility specific properties.

      # Provides extra control for each logger.

      ############################################################


      # For example, set the com.xyz.foo loggerto only log SEVERE

      # messages:

      com.xyz.foo.level = SEVERE

      com.microsoft.sqlserver.jdbc.internals.SQLServerResultSet= OFF

      com.microsoft.sqlserver.jdbc.ResultSet =OFF

      com.microsoft.sqlserver.jdbc = OFF


      c)System thread pool size


      <!-- A Thread pool service -->

        <mbean code="org.jboss.util.threadpool.BasicThreadPool"

           name="jboss.system:service=ThreadPool">

           <attribute name="Name">JBoss SystemThreads</attribute>

           <attribute name="ThreadGroupName">SystemThreads</attribute>

           <!-- How long a thread will live without any tasks in MS -->

           <attribute name="KeepAliveTime">60000</attribute>

            <!-- The max number of threads in the pool-->

           <attributename="MaximumPoolSize">100</attribute>

           <!-- The max number of tasks before the queue is full -->

           <attributename="MaximumQueueSize">1000</attribute>


      d)Set database pool size

      <min-pool-size>100</min-pool-size>

      <max-pool-size>300</max-pool-size>

      Add parameters above into the *-ds filesunder %JBOSS_HOME%\server\all\deploy


      3.Here are some test results pictures below

      1.png

      1


      2.png

                                                                               2

      3.png

                                                                               3


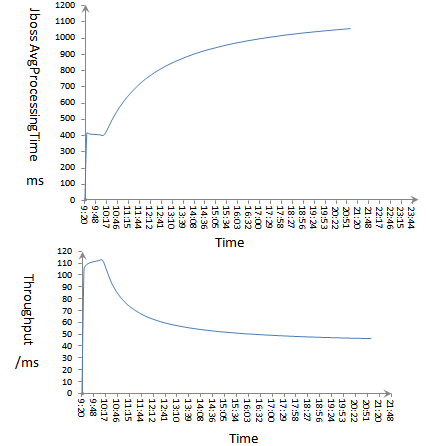
      Pic1.You can see, with the time increase JBossAvgProcessingTime become more and more large finally become stabilized.


      And then Throughput become more and more small finally become stabilized too.


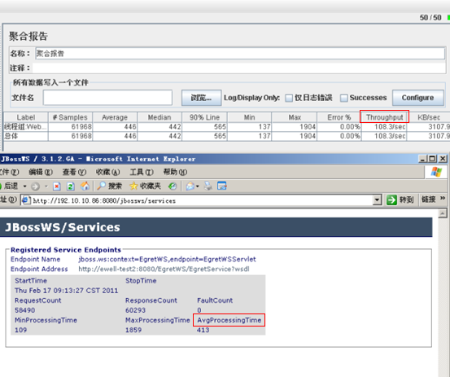
      You can see more about AvgProcessingTime and Throughput means from Picture 2.


      Question1:Why the JBoss performanve finally become almost half slow than first?


      Question2:Why the RequestCount is less than ResponseCount?


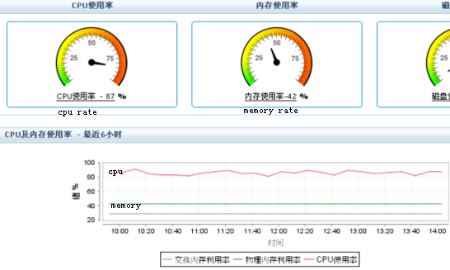
      Picture3.This picture tell us,cpu almost aroundat 85% and memory around 42%,

      So it can’t caused by hardware.


      And who can tell us more about theparameter (c)system thread pool size means?


      Anyone can help me? thanks
        • 1. JBoss performance decrease
          wdfink

          Sounds like a memory leak, I've had a similar problem where objects are not released and the heap become occupied.

          In this case the GC will consume the time.


          Do you can activate the GC logging?

          See http://java.sun.com/docs/hotspot/gc5.0/gc_tuning_5.html for JVM options.

          Also you can use 'jstat', part of java distribution with Java6 I'm not sure whether standard for Java5, to analyse the GC behaviour.

          1 of 1 people found this helpful
          • 2. JBoss performance decrease
            peterj

            I see that for the first hour, things go along just fine, then rapidly deteriorate. It would appear that your working set size is gretaer than 600MB, and with the heap settings you have, once you reach 600MB in the old generattion the JVM will perform only major collections and no minor collections. Wolf-Dieter's recommendation to log the GC data and then also analyze it is a good one. You will probably have to increase your heap size. I assume you are running a 32-bit OS in which case you will be limited to about a 1.5GB heap.


            For suggestions on how to gather GC data and analyze it,see these white papers:

            Java Garbage Collection Statistical Analysis 101

            Java Garbage Collection Performance Analysis 201

            at http://www.cmg.org/cgi-bin/search.cgi?q=java+peter+johnson&x=30&y=10

            1 of 1 people found this helpful
            • 3. Re: JBoss performance decrease
              bushurui

              Thanks for Wolf-Dieter and Peter's answer, I am reading Peter's white papers now.

              And i have done another test, this time i set 10 threads in Jmeter, and the throughput first time above to 42 and one night later fall to stay at 37.4.

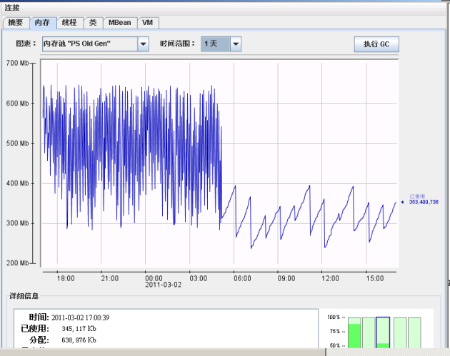
              Follow charp is the "Full GC" record by Jconsole with JBossAS. I can't understand why at first time, full gc happend so often, but when the 'Troughput' become stay at 37.4, the full gc become happen allmost once every hour?

              gccharp.bmp

              • 4. Re: JBoss performance decrease
                bushurui

                1.png

                                                                    Figure1

                eden_charp1.bmp

                                                 Figure2 PS Eden space(committed=307.2M Max=307.2M )


                survivor_charp1.bmp

                                                 Figure3  PS Survivor space(committed 51.2M Max=51.2M)

                majorgccharp1.bmp

                                                   Figure4   PS Tenured space


                Hi, this is the GC data map record by Jconsole come with JDK1.5. One houre later, major GC become so busy...and the Throughput in Jmeter become decrease with the time. I have increase the heap size above to 1300M. If more rhan 1300M, there will throw error ...So maybe in my enviroment the heap size limited to about 1.3G.


                Should i increase the survior space? 

                Or there's something else going unnormal in my enviroment?

                • 5. Re: JBoss performance decrease
                  bushurui

                  It looks like one hour later, one minor GC can only collect little die objects in survivor space, there are many objects are survivoring.

                  Then in the next minor GC time, lived objects fills up in the survivor space, any remaing live objects will copy to tenured generarion.

                  So we can see, major GC become more and more often then that in the first hour...


                  But what make me adoubt as why one hour later, the objects become difficult to release...


                  Can somebody help me to find out the problem with me?


                  Thanks!

                  • 6. Re: JBoss performance decrease
                    peterj

                    Sounds like you need to dump the heap contents and examine them. VisualVM and jmap can help generate the heap dump. VisualVM can analyze the dump telling you what objects are in the heap. If you use VisualVM to dump the heap, you can ask it to compare two heap dumps to see what changed.

                    • 7. JBoss performance decrease
                      bushurui

                      My JBoss5.1 was run in JDK1.5 ,and i find VisualVM can't do "heap dump" in that kind, So i choose jmap to do the heap dump,


                      and i will use eclipse to analyze the dump .


                      http://blog.richeton.com/2009/06/12/memory-analysis-with-eclipse-35/

                      • 8. JBoss performance decrease
                        wdfink

                        Hi,

                        I recommed you run the JBoss5 with the JVM6 (actual patch) because in our environment the JVM is faster then the JVM5.

                        We measure in some special cases 20%.

                        • 9. Re: JBoss performance decrease
                          bushurui

                          update:


                          when i update the JBossWS native stack version from jbossws-native-3.1.1.GA to jbossws-native-3.3.1.GA the problem can be resolved.


                          and if you choose JBossWS-CXF the performance maybe greater ...