SwitchYard performance pitfalls
synclpz Jul 22, 2013 9:10 AMI've perfomed some load-tests for SY-based infrastructure and results appear to be very bad
I tried to monitor running AS with SY via JVisualVM, and found potential bottlenecks, but have no idea WHY do some of them appear to execute so slowly.
The infrastructure looks like this:
1. Customized bpm-service quickstart (added custom workItemHandler to BPM process and exposed via SCA service reference)
2. RemoteInvoker from remote-invoker quickstart's "test" part (made multithreaded and additionally customized while playing, see below)
All two projects attached in dev.zip.
The machine in Core i5-2400 CPU + 8GB memory workstaion, running Windows7 and jdk7u25 x86_64, JBoss EAP6.1 Final (added -Xmx4096M to JAVA_OPTS).
First of all I'd like to say that default HttpInvoker, that is used in SY core and SY remoting is awful in it's performance. Due to usage of HttpUrlConnection it does create up to 2048 connections to sy-remote-servlet and then tomcat gives up making new threads to process requests, so I get socket errors. Anyway, this logic is rather CPU-heavy (because of many-many-many threads) and is not suitable in production environment. I wrote my own implementation of HttpInvoker (see customized RemoteInvoker class) based on apache httpcomponents http-client 4.2.5. It allows real multithreading and blocking upon maximum connections reached. Testing with "clean" JBossAS (simple servlet) resulted in near 5000 TPS, tomcat threads ~150.
Then, I get my custom invoker to point to SY bpm-service (exposed via SCA-binding). Performance dramatically dropped down to ~1200 TPS and some very strange things start happening:
1. Some deserialization exceptions radomly appear while receiving response
2. Some processing (SwitchYard) exceptions apper while processing request in SY
3. As time goes by, performance drops down in two ways:
a) After ~150000 requests processed performance degrade ~twice in a minute
b) Then it falls down ~logarithmically
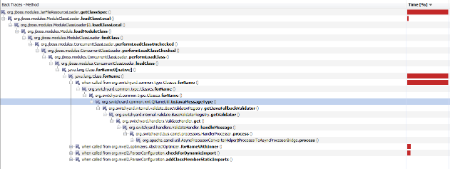
After sampling with jvisualvm, the first strange thing that I saw was that we have a bottleneck in classloader (through switchyard's Classes.forName() to org.jboss.modules.JarFileResourceLoader.getClassSpec()), but I can't understand why we need to constantly load classes? I thought it should be done once, at the first execution of service (see first 6 snapshots in attached archive sampling.zip).
The second strange thing that upon performance drop (at ~150000 requests processed) jackson's InternCache starts to dramatically slow down (see snapshots 6-10)! It is invoked upon JSON DEserialization on both server and client side, and both have the same issue... I can't find any solution why does it slow down perfomance cause it's simple cache with 192 elements inside (look at the source org.codehaus.jackson.util.InternCache.intern()). All my thoughts are that it is synchronized method, but number of threads invoking it does not change...
After continuos load test from 19.07 to 22.07 (I tried to process 50 000 000 requests) I found only 15 000 000 processed and system performing at ~120 TPS, using the whole CPU. The hot point is still InternCache.intern() (see the last snapshots in sampling.zip).
Conclusion:
1. HttpInvoker is not good enough for performance and multithreading
2. Jackson JSON deserializer is, possibly, main performance issue in SY processing
3. Spontaneous errors processing requests occur (exceptions returned instead of results)
I'll try to perform this test on Linux today also.
Questions:
1. Any possibility to update internal invocation interface to some binary/more fast one? Maybe I should use HorneQ or other bus to integrate services in SY instead of SCA? What about load-balancing then?
2. Could someone of devs help to investigate spontaneous errors occuring under load (point 3 from conclusion)?
3. Any recommendations to achieve high-performance, high-thoughput solution?
Thanks in adavnce,
V.
-
sampling.zip 3.8 MB
-
dev.zip 133.3 KB
