Wildfly version 8.2.0-Final
Hi,
We have introduced clustering into a dev environment and are hitting regular OutOfMemory issues within about 12 hours.
I dumped the hprof file after about 4 hours and had the JVM dump a hprof file when it blew up. It seems there are a large number of the org.hornetq.core.client.impl.ClientSessionFactoryImpl classes and I'm trying to investigate this further.
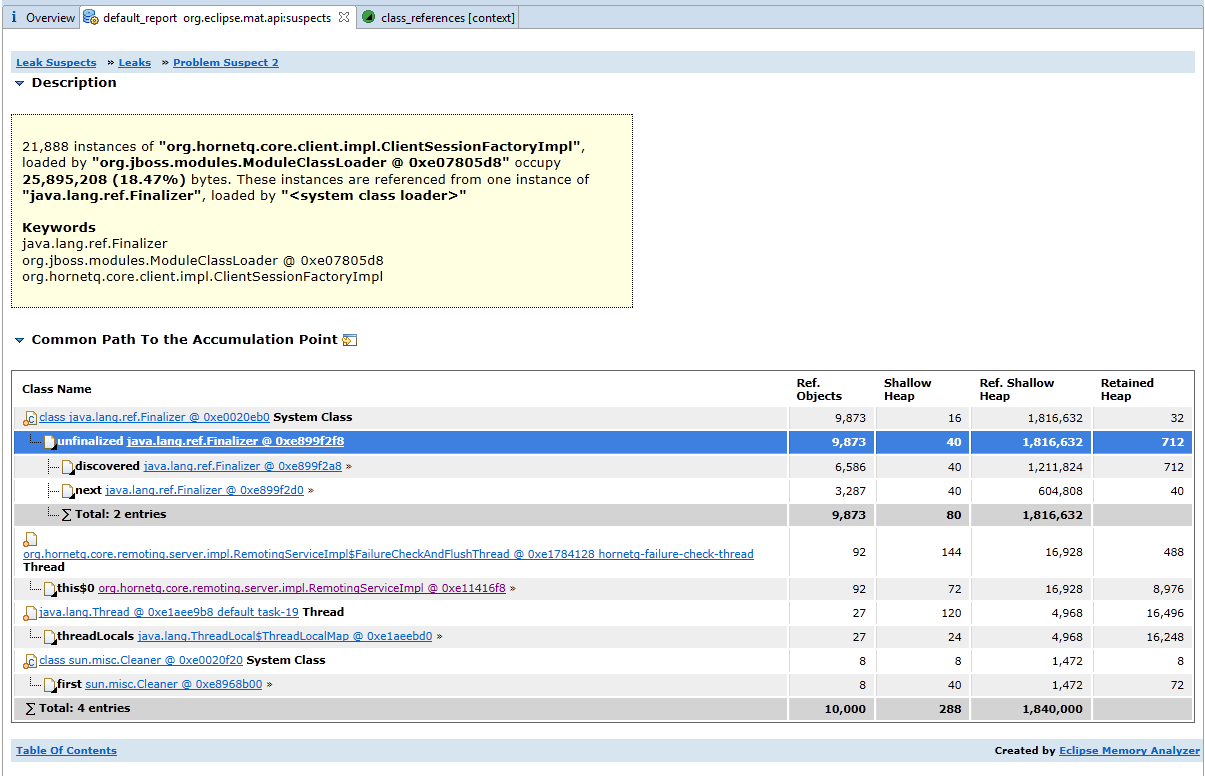
Eclipse memory analyzer highlights ClientSessionFactoryImpl as a Leak Suspect and states:
21,888 instances of "org.hornetq.core.client.impl.ClientSessionFactoryImpl", loaded by "org.jboss.modules.ModuleClassLoader @ 0xe07805d8" occupy 25,895,208 (18.47%) bytes. These instances are referenced from one instance of "java.lang.ref.Finalizer", loaded by "<system class loader>"
Keywords
java.lang.ref.Finalizer
org.jboss.modules.ModuleClassLoader @ 0xe07805d8
org.hornetq.core.client.impl.ClientSessionFactoryImpl
At first i thought it was linked to our management of JMSContext instances and not closing them. We were injecting a Instance<JMSContext> and calling the get() method every time we are sending a message to a topic/queue but never the close() method after.
I changed this to simply Inject a JMSContext and use it in the standard approach but we are still seeing the OutOfMemory issue. Basic idea behind the code:
@Inject
private JMSContext context;
public void send(String msg) {
Message message = context.createTextMessage(msg);
context.createProducer().send(destination, message);
}
As i say, this didn't fix the situation and now i'm at a bit of a dead end with regards to what may be causing this. I have attached a screenshot of the suspected leak report from Eclipse Memory Analyzer.
Can anyone provide any assistance on where issues like this may appear or point my in the right direction of where to look?