if my auto-baseline were working would it had flagged this Wait Load?
Hello,
Ok Ok.. I will share yesterdays iowait problem.
One evening we had intermittent server failure and APDEX trough for the server stats.
We typically have performance problems on our NFS shares, so in hindsight CPU iowait seems like a good thing to monitor at all times.
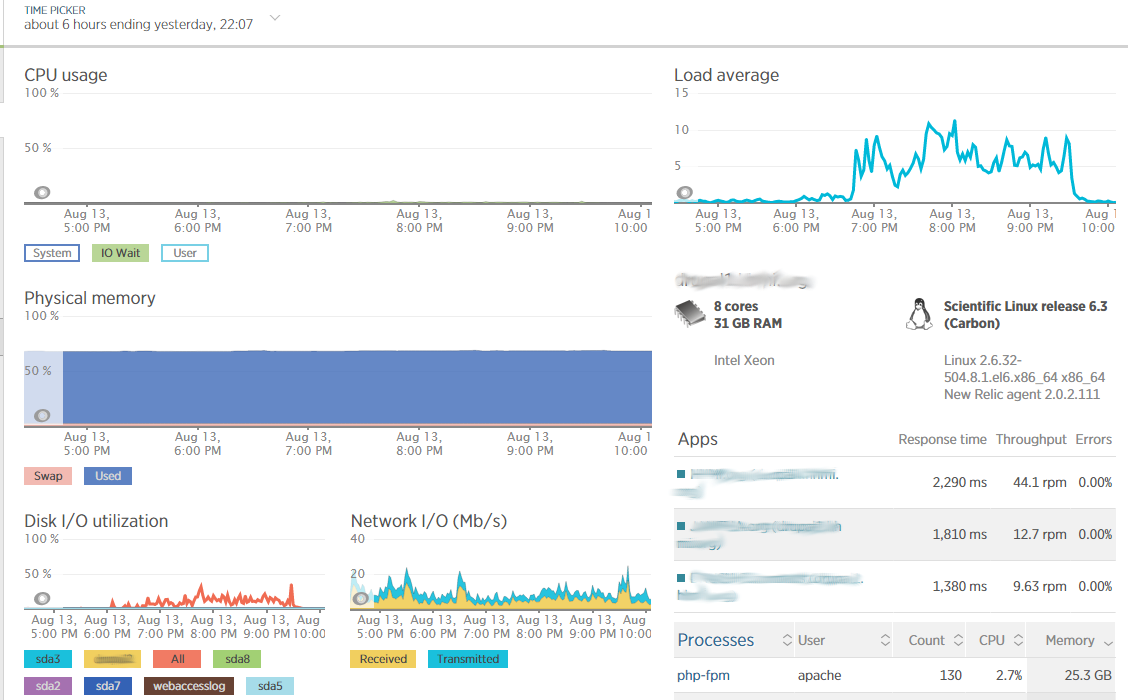
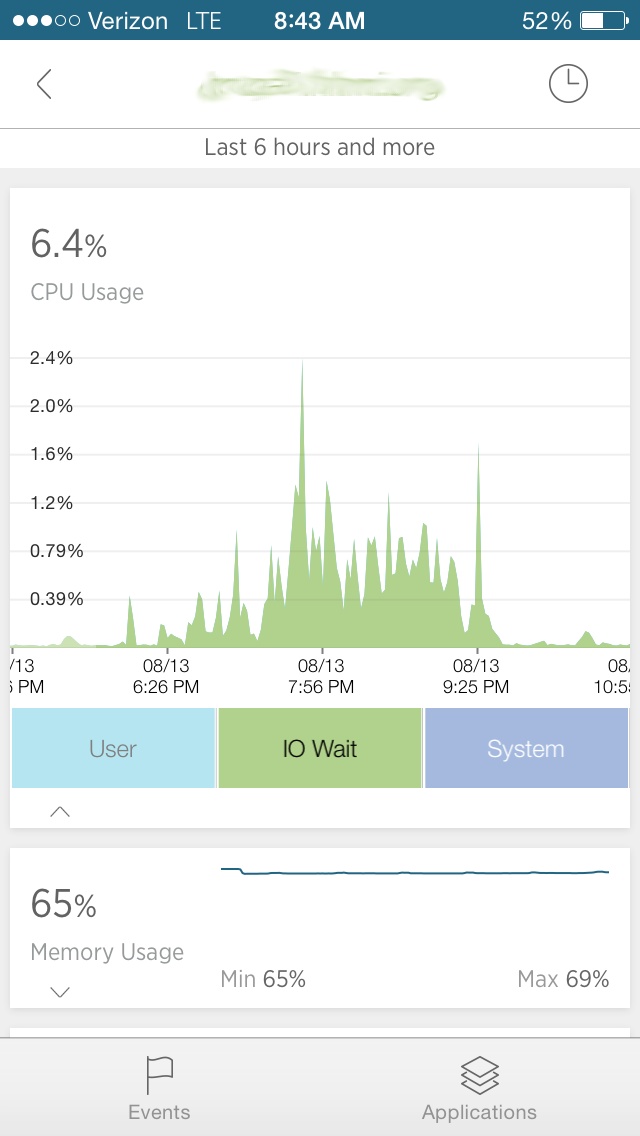
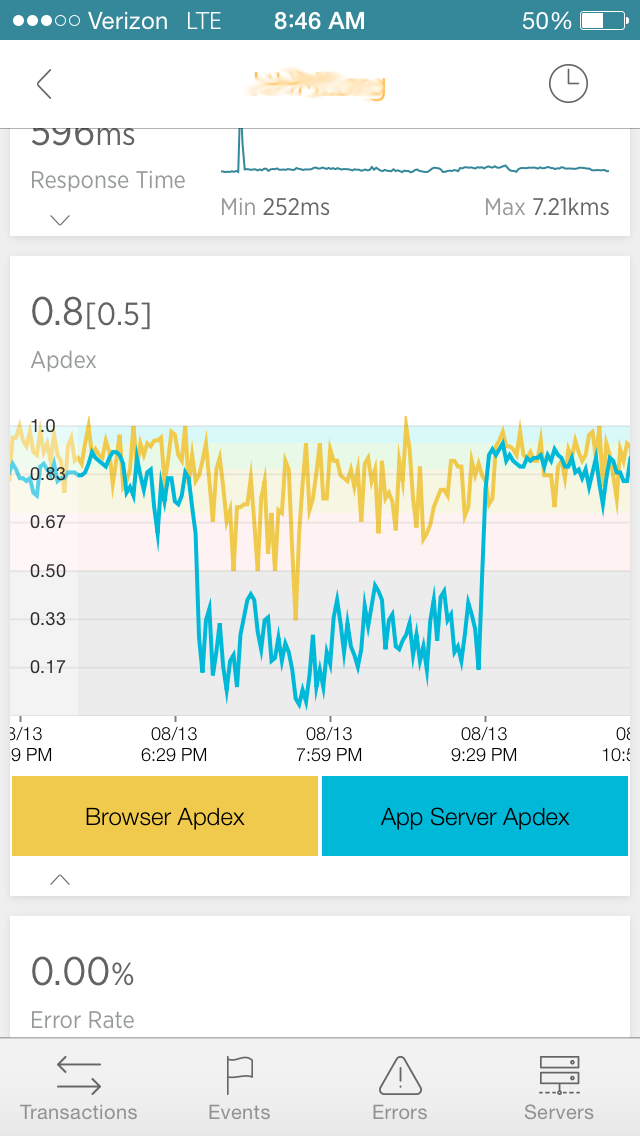
First, I was focused on the problem mainly by my iphone NewRelic app -- it clearly showed the excess iowait on the filesystem. The NR web interface not so much, iowait far less visible. It showed "load" and "disk io" labeled metrics (the labels are inconsistent with the iphone app).
Based on just the reading of the iphone I was able to send a message to the right people to fix the problem, averting further intermittent server failures that evening. If I had read just the NewRelic web interface, I would not have been pointed to the information.
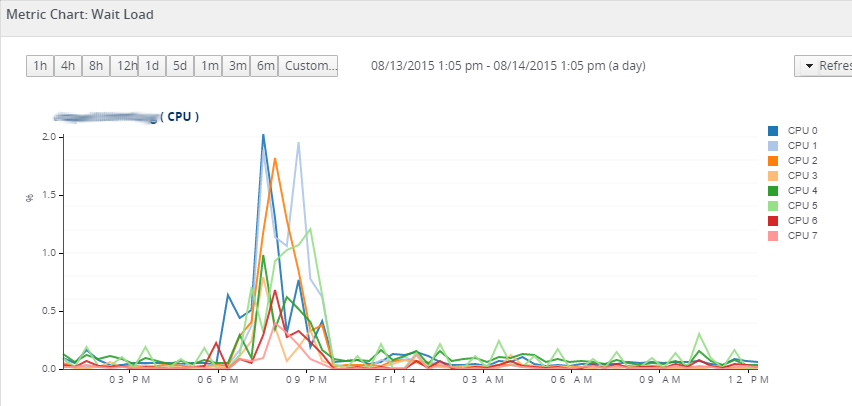
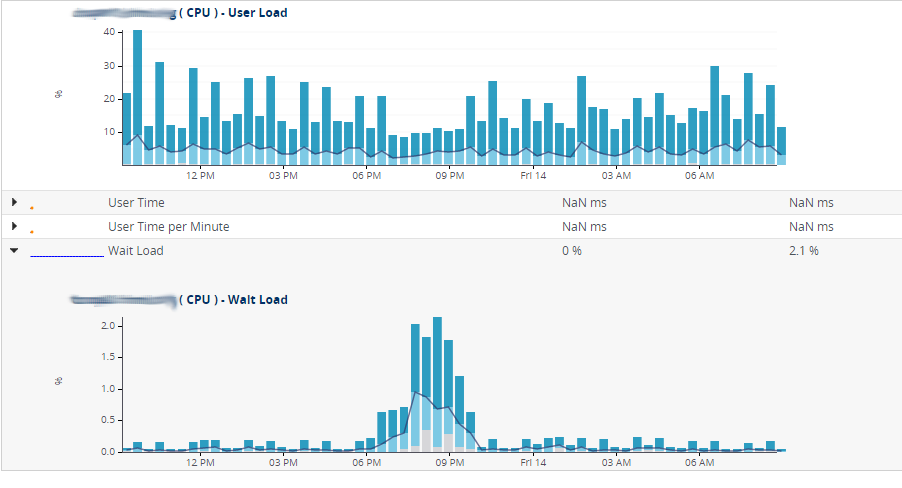
And if I had just the RHQ interface I would have found nothing during the event -- my suspect metrics report is not working, and it took me too long to find the out-of-bounds metric Wait Load on the CPU resources (and that metric also bubbled up to the platform metrics I'm guessing).
In RHQ the following day on premises I was able to correlate the iowait graph on the iphone with the RHQ metric "Wait Load". On RHQ I was also able to set up an alert on that particular metric when it goes above 1%, or even when any change occurred to I can see how the changes are.
In NewRelic, I was unable to find any way to set up an alerting on the iowait metric. There are only 4 metrics there to set an alert on for sysmond, not including IOWait which is what their iphone app showed me! Just some other really basic metrics. This resonates with what Nagios people think: The problem is that monitoring systems are not turnkey solutions.
My experience was inconsistent in that:
1) I first saw the problem highlighted on the NR iphone interface, an interface (up to now) I don't take as seriously as the web interface
2) the iowait problem was not really visible at all on the NR web interface (see screenshots)
3) I could not find a way to alert on iowait in NR
4) RHQ allowed to alert on detailed conditions, but didn't alert during the event because autobaselining is not working correctly and I couldn't find metric Wait Load in time.
Questions
1) I need to fix my RHQ auto-baselining to that Suspect Metrics Report is working as expected? Where do I start to debug this?
Regards,
Rich "I really want to commit mindshare to RHQ or NewRelic but not both, and for heavens sake we now have dotcom-monitor for RTMP and not-to-mention Nagios and zookeeper and Saltstack"