More weeks of development have passed and we have just released version 0.2.2.20140726-M3 to the JBoss Nexus maven repository.
This release contains a major update to the Angular tag to display metrics and also to the (developer focused) metrics console
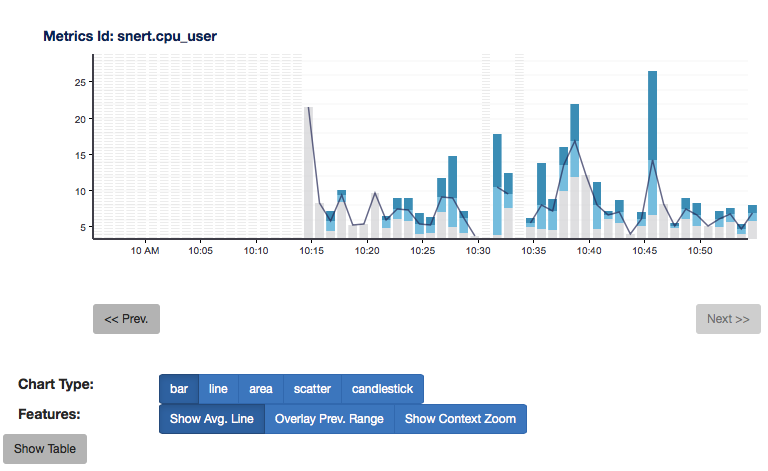
RHQ-style bar graphs:

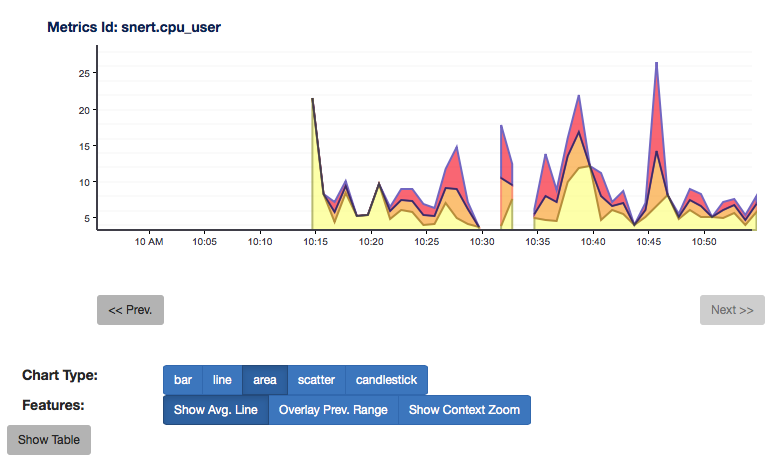
Area charts:
Mike has created a video explaining the console:
Other new features are the possibility to list metrics in the system via
$ curl http://localhost:8080/rhq-metrics/metrics
so that tools like Grafana (via InfluxHandler) can directly populate the metric name drop down from the rhq-metrics backend. This was partially available earlier via an in-memory implementation, but once the rest-app got restarted it lost its memory.
It is also now possible to delete individual metrics (the whole time series, not just a point in time).