This content has been marked as final.
Show 12 replies
-
1. Re: Memory consumption 1h after JBoss start
peterj Jan 20, 2010 3:41 PM (in response to gifor)
You need to examine the heap and figure out what objects are suddenly occupying the heap. Tools to use include jmap and VisualVM, both of which come with the Sun JDK 6.
VisualVM even lets you compare two heap snapshots to see which objects have suddenly increased in number.
-
2. Re: Memory consumption 1h after JBoss start
luv Jan 22, 2010 4:45 AM (in response to peterj)
I think its because of concurrent hits due to load testing.
For example for the production there is no need to generate the application server log and application log.
It reduce the performance by 1.6 to 2 times.
Better way for load testing would be try after stopping the log. I guess.
-
3. Re: Memory consumption 1h after JBoss start
formenti Jan 22, 2010 5:50 AM (in response to luv)
Hi luv,
you are right but before the test I disable all kind of logging
Thank you for your support
Regards
Giovanni
-
4. Re: Memory consumption 1h after JBoss start
formenti Jan 22, 2010 6:06 AM (in response to peterj)
Hi Peter,
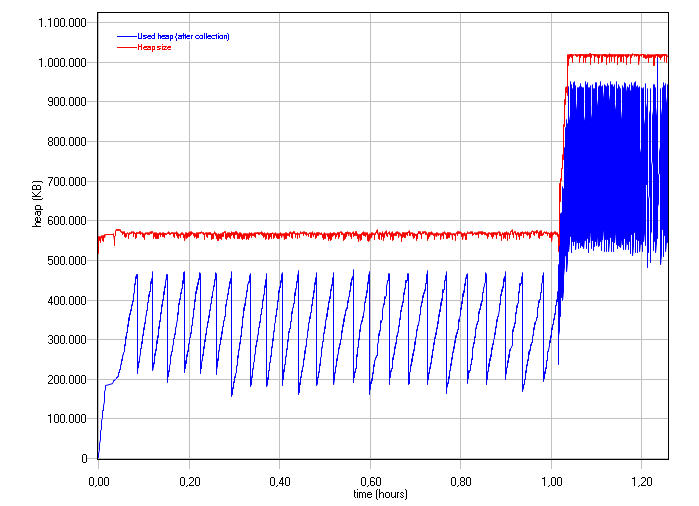
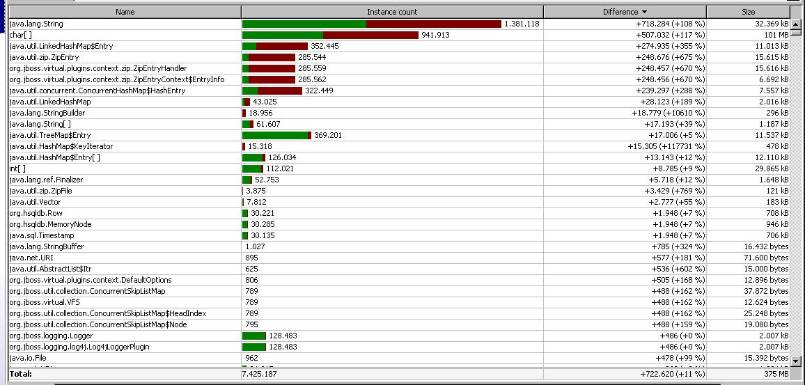
I used Eclipse MAT (a great tools IMHO!) and also JProfiler. This is the difference between the memory after 50min and 63min (the peak is around 60min).
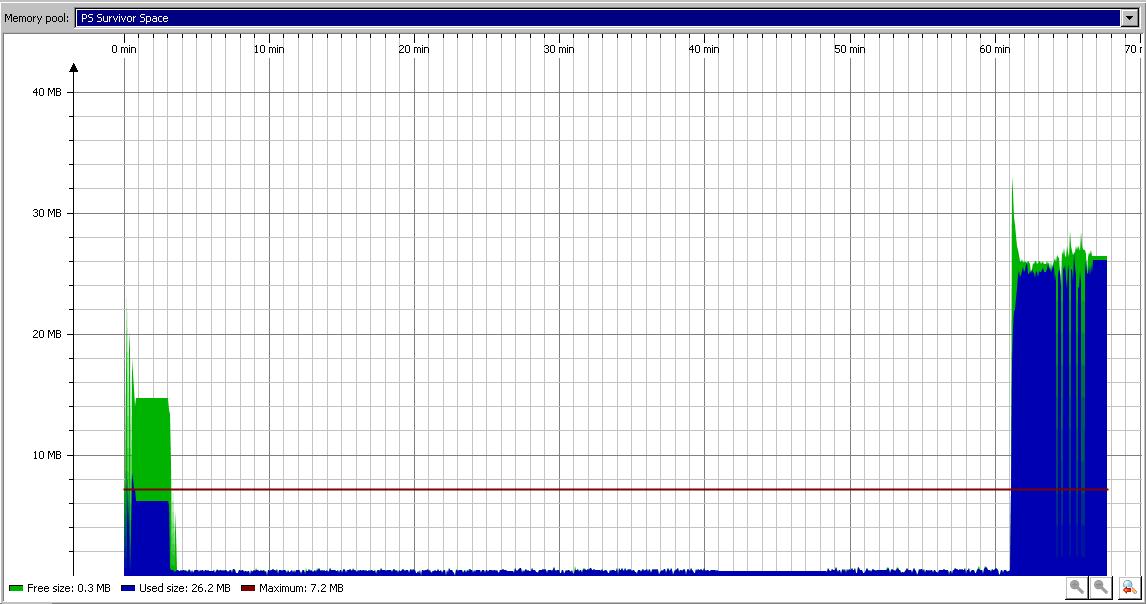
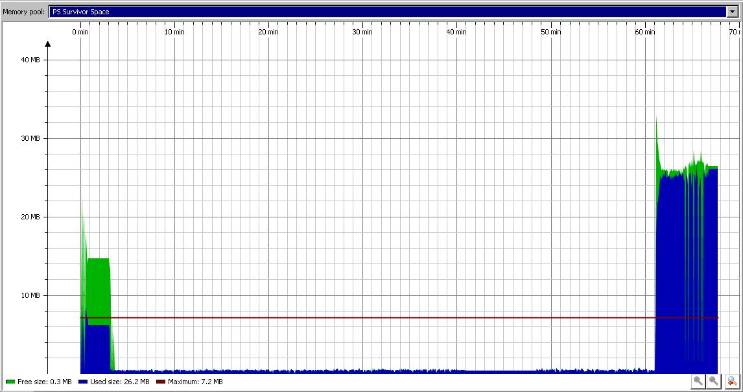
I trace the GC also and I notice a strange behavior of Survivor Space when the GC begin its intensive activity (after 1h). It seems that it exceeded the maximum:
Exploring the memory dump, the Maps and ZipEntries seem to be related to MBean map and deploy/vfs structures. Their shortest path to GC root involve http-0.0.0.0-8080 threads.
This could be related to connection pools or aliveness of connections?
Thank you for any tips about this
Regards
Giovanni
-
5. Re: Memory consumption 1h after JBoss start
peterj Jan 22, 2010 3:56 PM (in response to formenti)
It almost looks like a new app is being deployed at that time. That would explain the huge jump in the number of Zip* instances. Is there anything in the log that might shed light on what is going on?
Also, add the "-verbose:class" JVM option to JAVA_OPTS in the run script. This option causes the JVM to print to stdout every class laoded and the JAR from which it came. It would be interesting to see what the output is when the spike happens. Of course, redirect stdout/stderr to a file - you will get a ton of output.
-
6. Re: Memory consumption 1h after JBoss start
ruchirc Jul 22, 2010 3:07 AM (in response to gifor)
Hello,
Please look into the following things, it will surly help you.
01> Your JVM setting is not as per Jboss or Sun Standards. both says the Xms and Xms need to be same. Try the below setup change it based on your system needs.
-Xmx2048m -Xms2048m -XX:MaxNewSize=256m -XX:NewSize=256m -XX:MaxPermSize=128m -XX:SurvivorRatio=8 -XX:TargetSurvivorRatio=90 -XX:MaxTenuringThreshold=0 -XX:CMSInitiatingOccupancyFraction=60 -XX:LargePageSizeInBytes=5m -XX:ParallelGCThreads=20 -XX:-DisableExplicitGC -XX:+UseParNewGC -XX:+UseConcMarkSweepGC -XX:ThreadStackSize=1024 -Dsun.rmi.dgc.client.gcInterval=3600000
-Dsun.rmi.dgc.server.gcInterval=3600000
I have listed a series of test on various parameters, as below(link) try to see if you can grab some info from there.
http://community.jboss.org/docs/DOC-15623?uniqueTitle=false
02> you can also use Visual VM provided by Sun to see if its something induced due to profiling, I dont see this as a reason but no harm is checking.
03> The the GC cycle when its happening and what is the object left in NEW Gen and Old Gen, dose it get cleared eventually or its holding up.
04> If its holding up than the problem is with the code, profile it, you will get explicit details which class, inner class, which method is causing it
05> Are you using a lot of static methords, caching in JVM or large session object
Please let me know how it goes, Publish the machine details too.
Thanks,
Ruchir
-
7. Re: Memory consumption 1h after JBoss start
peterj Jul 22, 2010 1:02 PM (in response to ruchirc)
Ruchir, your suggested newsize is too small for the heap size specified - the newsize should be 1/3 - 1/4 the size of the heap. By the way, based on my tests, if you do not specify a newsize, JDK 6 eventually adjusts it to about 1/3 - 1/4 the heap size (just realized that was with the standard collection, not the CMS collector, but I suspect that letting the ).
Setting MaxTenuringThreshold to 0 is a bad idea - I puts a larger strain on the CMS collector and degrades overall applicaiton performance. It is much better ot let needed objects survive a few minor collections before being tenured, and thus let the minor collector gather all the garbage, than requiring the CMS collector to collect objects that die soon. Besides, setting the UseConcMarkSweepGC sets MaxTenuringThreshold to 0 by default (and also sets the survivor spaces to a really small value.
It is not always advisable to set UseConcMarkSweepGC. You must test your application both with and without it to determine hte best performance. Also, with UseConcMarkSweepGC, during a major collection, one of your CPUs will be dedicated to garbage collection. If you have only 2 CPUs, then you will reduce the amount of load your app can handle by 50%.
For suggestions on how to gather GC data and analyze it, see these white papers:
Java Garbage Collection Statistical Analysis 101
Java Garbage Collection Performance Analysis 201 (this white paper discusses the CMS collector and its gotchas)
at http://www.cmg.org/cgi-bin/search.cgi?q=java+peter+johnson&x=30&y=10
-
8. Re: Memory consumption 1h after JBoss start
ruchirc Jul 22, 2010 5:37 PM (in response to peterj)
Apprecite your suggestions,
It all depends how you want to do it, JVM parameters gives a lot of flexibility to you and there is no one size fits all.
Moreover my intent was to help the team get some idea, and not to cut copy the exact thought, Diffrent app requires different type of setup.
We ran series of test "Load, noise, bursting, endurace" with multiple appications on single Jboss EAP4.3 with different veriosn of JDK. Results came best with the setup we have explained.
We used
-XX:MaxTenuringThreshold=0because itpromotes all objects allocated by the application in the young generation, which survive a single GC cycle, directly to the old generation without copying them around between the survivor spaces in the young generation. This setting, when used with CMS collector in the old generation helps in two ways.
- The young generation GC does not have to waste its time copying the 10-20% long lived objects multiple times between the survivor spaces, only to finally promote them to the old generation.
- Additionally, most of the collection and cleaning work of these objects can be done "concurrently" in the old generation. This behavior leads to additional reduction in GC sequential overhead.
http://java.sun.com/developer/technicalArticles/Programming/turbo/
This setup was also good based on our test scenarios.
I guess you are bringing some good points, we will use this in next series of test.Keep giving new Ideas
Respectfully,
Ruchir Choudhry
-
9. Re: Memory consumption 1h after JBoss start
peterj Jul 23, 2010 2:13 PM (in response to ruchirc)
I ageee that your explanation of setting MaxTenuringThreshold to 0 is the commonly accepted advice. But of course, I disagree
The problem with setting MaxTenuringThreshold to 0 is that at the time the minor GC takes place you will have a lot of temporary objects that are still in use being promoted to the tenured generation. Then the tenured generation fills up quicker and you end up doing major CMS collections more often. It is usually better to let objects bounce around a few times between the survivor spaces in order to sift out objects that survive only a few collections and are then discarded, thus ensuring that only object that plan to stay around for a while get tenured.Tenuring temporary object is much more expensive than not tenuring long-lived objects.
Test I have done show that the minor collection time, even with MaxTenuringThreshold not set to 0, is consistently less that the two pauses times caused by the CMS collectior for a major collection. In addtion, having MaxTenuringThreshold set to a non-zero value has, in my tests, always outperfomed setting MaxTenuringThreshold to 0 (higher throughput, lower response times). At least, that is what I have observed in the many load tests that I have performed.
Of course, all apps are different - the reader is urged to perform his or her own load tests to see how their apps respond.
And Ruchir, I agree with you that discussions like this are benefitial to the community. Hopefully the readers can take our two views into consideration and find what works best for their apps.
-
10. Re: Memory consumption 1h after JBoss start
jozsef_attila Aug 4, 2010 7:32 AM (in response to gifor)
Hi Giovanni,
Did you find a solution to this memory consumption? I think we may be suffering from something similar.
Regards,
Jozsef
-
11. Re: Memory consumption 1h after JBoss start
ruchirc Aug 5, 2010 1:27 AM (in response to gifor)
-Xms512m -Xmx1024m--Can you please try try to make Min and Max of Heap as same, and publish the results.-Xms512m -Xmx512m
-
12. Re: Memory consumption 1h after JBoss start
jozsef_attila Aug 5, 2010 2:27 AM (in response to ruchirc)
Hi,
Actually it looks like after exactly 1 hour it starts leaking unnamed event handles. This is on Windows 2003 server, JBoss 5.1, Java 6 u20. The application does nothing special after exactly 1 hour from startup.
I wonder if this is related to https://jira.jboss.org/browse/JBVFS-159
Regards,
Arthur