This content has been marked as final.
Show 9 replies
-
1. Remote debugging
myjboss2020 May 16, 2011 1:34 AM (in response to myjboss2020)
UPDATE: After restaring the Jboss application server, I managed to log-in just fine..but it still not hitting my break points..
-
2. Remote debugging
wolfgangknauf May 16, 2011 11:13 AM (in response to myjboss2020)
Hi,
do you use either the "JBoss Tools" or the "Eclipse Webtools Platform" plugin? In both cases, you manage (start, stop, deploy) your server through the IDE, and here you can start your server in Debug mode. With this approach, you don't have to care about all this commandline stuff ;-).
Hope this helps
Wolfgang
-
3. Remote debugging
myjboss2020 May 17, 2011 3:25 AM (in response to wolfgangknauf)
Hi,
Yes, I'm using JBoss Tools plug-in as well. I know I could start the server in debug mode in IDE, but the catch is, in my case,
my application starts a new commandline tool ( some sort of runtime ) as part of its start up. I've noticed..I can't start that command line tool/runtime, if I start the application server from IDE. hence I'm starting the server from command line. Hope that sheds bit more light.
So you reckon, we can't do remote debugging if we start the server from command line?
Any thoughts?
-
4. Remote debugging
wolfgangknauf May 18, 2011 7:40 AM (in response to myjboss2020)
Hi,
how do you start the server by default? Do you use a custom startup script, or do you use the standard "run.bat"/"run.sh" and the command prompt is started later by an app deployed to the server?
If the latter is true, then it should work also when starting the server through eclipse. And if the first is true, we might be able to modify the launch configuration.
But basically, remote debugging should also be possible, but might be tricky. So it would be easier to start the server from the IDE.
Best regards
Wolfgang
-
5. Remote debugging
myjboss2020 May 18, 2011 9:23 PM (in response to wolfgangknauf)
Hi I'm using using the standard run.bat ( in Windows 7). During one of the actions, my app creates a new instance of a library/more like a custom runtime. I've noticed, when we start application server from the IDE, my app cannot create a new instance of the library/runtime. However, it can when we start the app server from command line. So command line has not been modified in any way( except for the debug parameters I've mentioned above.
If we can set up remote debugging, could you please let me know where I can find relavent information.
-
6. Re: Remote debugging
wolfgangknauf Jun 3, 2011 5:35 AM (in response to myjboss2020)
Hi,
this guide seems to be very detailed: http://oreilly.com/pub/a/java/archive/eclipse-jboss-remote-debug.html?page=6
When following this guide, please note the comments at page 8, there seems to be a typo (one space at the wrong location) in the commandline used to start JBoss (step 6).
I see that your command line also has a typo: "suspent=n" should be "suspend=n".
Hope this helps
Wolfgang
-
7. Re: Remote debugging
myjboss2020 Jun 1, 2011 10:28 PM (in response to wolfgangknauf)
Thanks Wolfgang!!
I've fixed debug options..
its now..
set JAVA_OPTS= -Xdebug -Xnoagent -Xrunjdwp:transport=dt_socket,address=9797,server=y,suspend=n %JAVA_OPTS%
in console..I found this..so seems to be good..
Listening for transport dt_socket at address: 9797
.
.
[ServerInfo] VM arguments: -Xdebug -Xnoagent -Xrunjdwp:transport=dt_socket,address=9797,server=y,suspend=n -Dprogram.name=run.bat -Xms128M -Xmx512M -XX:MaxPermSize=256M -Dsun.rmi.dgc.client.gcInterval=3600000 -Dsun.rmi.dgc.server.gcInterval=3600000 -Dorg.jboss.resolver.warning=true -Djava.endorsed.dirs=C:\Program Files\jbdevstudio\jboss-eap\jboss-as\lib\endorsed
did a netstat -an and found this..
TCP 0.0.0.0:9797 0.0.0.0:0 LISTENING 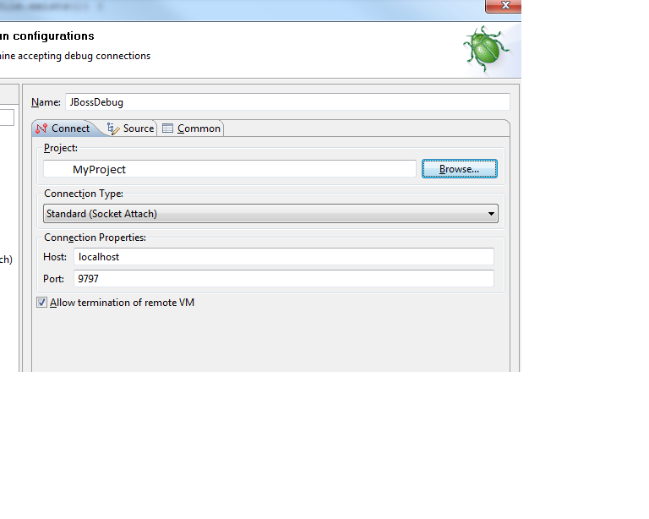
and when I clicked on Debug button here..nothing seemed to have happened. well..IDE did not launch my web application..and in netstat -an output I found this. can we assume here that IDE is now connected to the debugging port that we set on the server? ( also, I'm running the JBoss server locally as well )
TCP 127.0.0.1:9797 127.0.0.1:45984 ESTABLISHED
Then added Java Exception breakpoint for the execption 'Excetpion' so I can see any exception thats been thrown by the app.
What do I have to do next..nothing seems to be happening here. Tried manually bringin my up my web app
http://localhost:8080/MyProjecthttp://localhost:8080/MyProject/login.seam/login.seam
and performed the action in question..and I can see errors in server conolse, but nothing happend in IDE.
I'ave attempted to do this..
http://localhost:9797http://localhost:9797/MyProject/login.seam/MyProject/login.seam
IE cannot display the webpage.
When I tried to reclick on debug button in my debug configuration..I'm getting..
failed to connect to remote vm. connection refused ( along these lines anyway)
Am I missing anything else here? pls let me know.
Cheers
-
8. Re: Remote debugging
myjboss2020 Jun 2, 2011 2:46 AM (in response to myjboss2020)
ok..I'm now hitting break points!!!
1. Start the server with debug options
2. Set up debug configuration in IDE
3. Click on 'Debug' button in debug configuration in IDE so it would connect to the debug port that is set up in server ( step1)
4. Bring up the web app as normal.
5. Set up break points in IDE
Its not hitting the break point. however, can't step in. It say source not found. even though I've got methods are all in there.
how can I make sure I can step in.
For example, I'm injecting an object using
@In
MyObjectClass myObject;
.
.
myObject.DoSomething();
I put a break point on the above line expecting when I step in, it'd go to DoSomething() method..but it complained that it can't find the sourse.
Any suggestions?
-
9. Re: Remote debugging
wolfgangknauf Jun 3, 2011 5:36 AM (in response to myjboss2020)
Hi,
in your screenshot, there is a tab titled "Source". Maybe you have to add the source code of your project here.
Hope this helps
Wolfgang
