This content has been marked as final.
Show 2 replies
-
1. Re: Modeshape Performance
rhauch Feb 21, 2012 9:17 AM (in response to kbachl) 1 of 1 people found this helpful
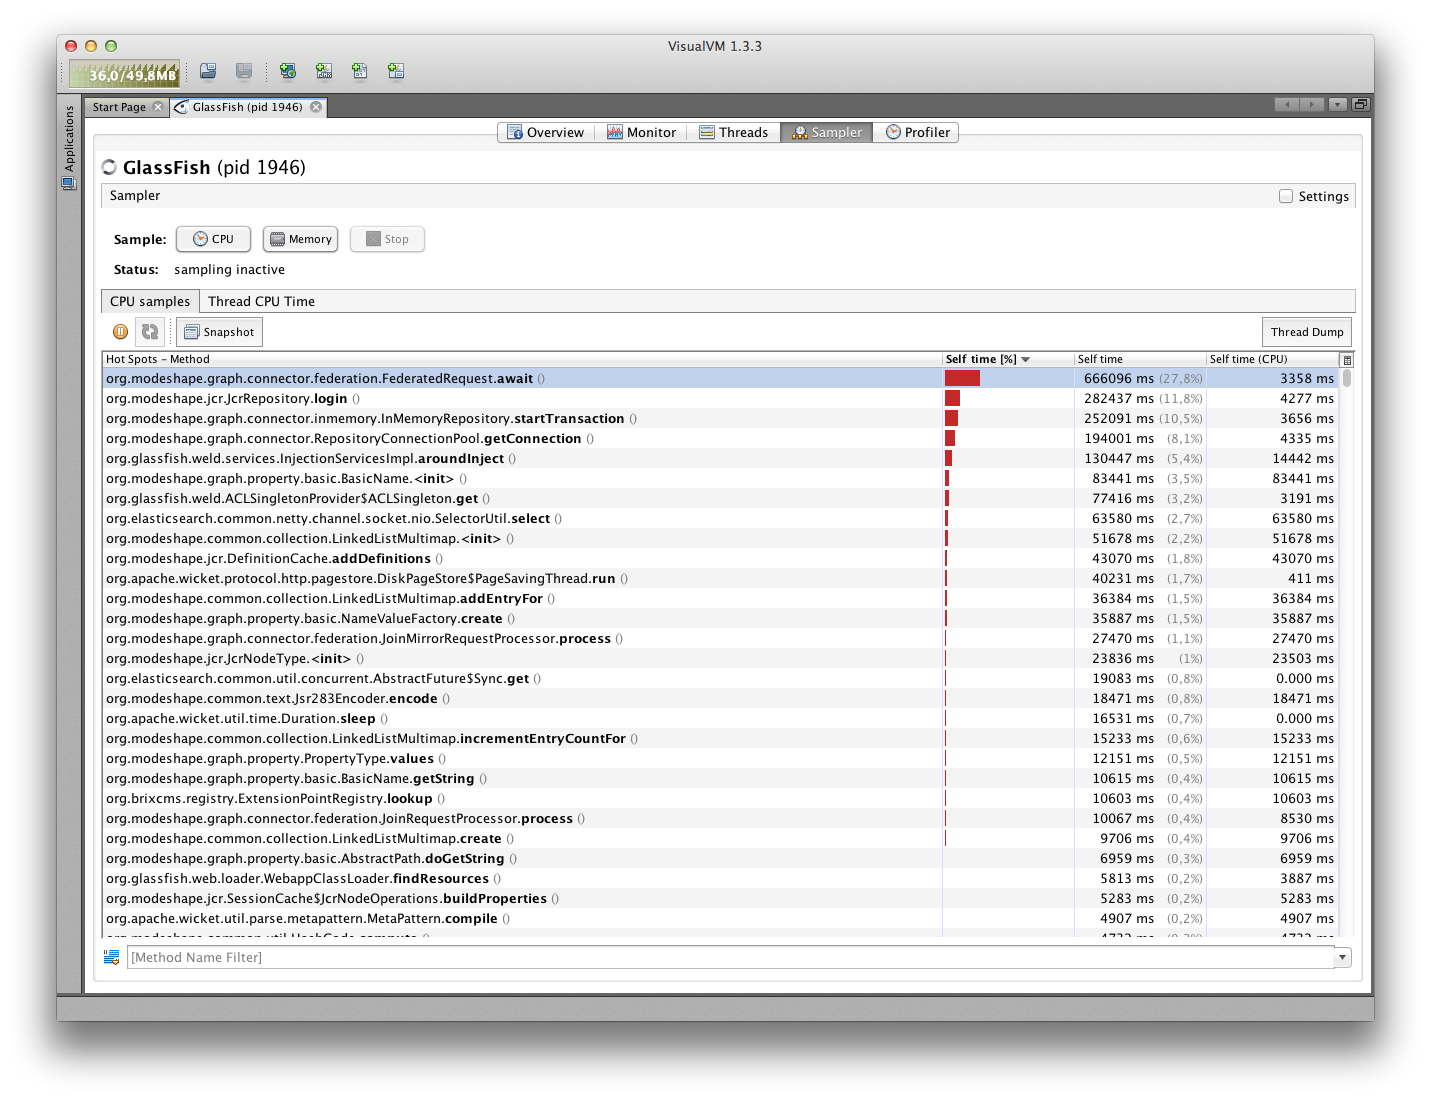
Offhand, these are some possible reasons why you might be seeing these results:
- FederatedRequest.await -- The federated connector works by creating and enqueuing the requests to the different underlying connectors (translating any path changes due to the projections), where the enqueued requests are sent to the connectors via a worker pool. This way, the connectors can start processing the request while the federated connector is still walking through the original requests. But after the federated connector finishes enqueuing the requests, it needs to wait until all of the requests are finished before it can return. So IMO, this is somewhat of an anomaly in how the measurement is being made, because your tests are only measuring how long (clock time) the "await" method takes, and does not measure CPU.
- JcrRepository.login - Not sure what might be taking the time here. Are you using JAAS or a custom authentication provider?
- InMemoryRepository.startTransaction - the InMemory connector uses a global write lock, which might be the problem here. Note that the InMemory connector is not often used in production. Each connector is a bit different, too.
- RepositoryConnectionPool.getConnection - This sounds like the pool is not configured well for your machine, and that you're allowing more threads than what can be used.
-
2. Re: Modeshape Performance
kbachl Feb 21, 2012 10:03 AM (in response to rhauch)
Thank you for answering, regarding the points:
1. ok, this explains it;
2. this is odd, as I rely on the anonymous login method.....
3. InMemory was the test to ignore any impact from my usually used DiskStore - what connectors are good for heavy concurrent access?
4. How can the pool be configured - or better said: where is it configured?