3 Replies Latest reply on Sep 4, 2012 1:55 PM by rhauch

    Memory leak/to much retained in WorkSpaceCache?

    bwallis42

      Running 3.0.0.Beta3 on JDK 1.6.0_33.


      I have a bit of code (shown below) that I am running against a populated repository that has 14524 nodes that are a subclass of nt:resource. These nodes each have a binary value in the jcr:data attribute that is 1024 bytes long. The code I run just does a query for all the nt:resource nodes (select * from [nt:resource]) then iterates through them reading the binary data from each and discarding it. Total binary data read from the nodes is about 14 MBytes.


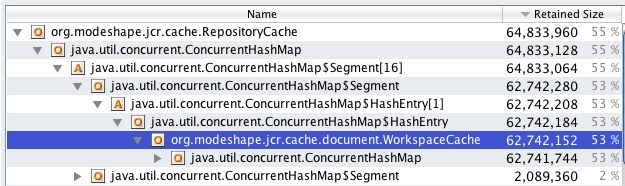
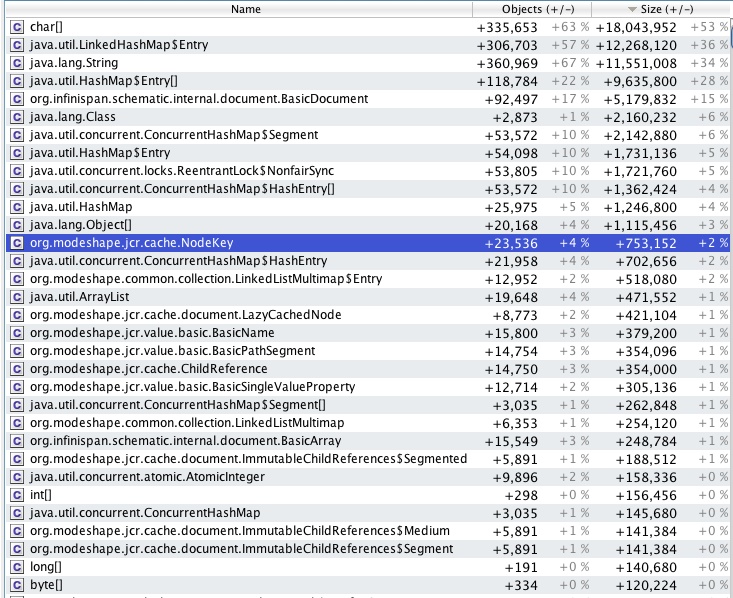
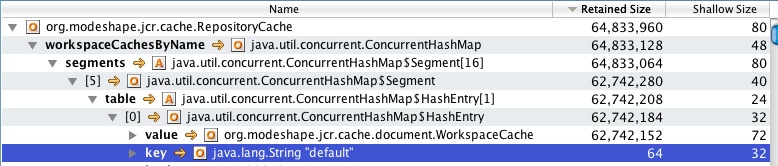
      When I run the download() method the heap of the JBoss JVM grows by about 430MBytes and this is never returned to the heap, it seems to be retained in the WorkSpaceCache (although I could be completly wrong about that, that is just where I traced a lot of memory references to using jprofiler).


      Is there something missing in the code shown that I should be closing or clearing or something? Running the code a second time does not increase the allocation (and in fact it runs very fast the second time).


      {code}

                public String download() {

                          Session session = null;

                          String querystr = "select * from [nt:resource]";

                          int blobsQueried = 0;

                          long totalSize = 0;

                          try {

                                    session = repository.login();

                                    QueryManager queryManager = session.getWorkspace().getQueryManager();

                                    Query query = queryManager.createQuery(querystr, Query.JCR_SQL2);

                                    log.info("Run Query = " + querystr);


                                    QueryResult result = query.execute();

                                    NodeIterator nitr = result.getNodes();

                                    int i=0;

                                    while(nitr.hasNext()) {

                                              Node node = nitr.nextNode();

                                              blobsQueried++;

                                              log.debug("Download Blob from Node "+node.getIdentifier()+" path="+node.getPath());


                                              Property property = node.getProperty("jcr:data");

                                              Binary binary = null;

                                              InputStream stream = null;

                                              byte[] blobData;

                                              try {

                                                        binary = property.getBinary();

                                                        stream = binary.getStream();

                                                        blobData = IOUtils.toByteArray(stream);

                                              } finally {

                                                        if (stream != null) {

                                                                  stream.close();

                                                        }

                                                        if (binary != null) {

                                                                  binary.dispose();

                                                        }

                                              }

                                              int size = blobData.length;

                                              log.info("Blob "+i+" is size "+size);

                                              totalSize+=size;

                                    }

                          } catch (LoginException e) {

                          throw new RuntimeException("Could not log into repository", e);

                          } catch (RepositoryException e) {

                                    throw new RuntimeException("Could not perform operation over the repository", e);

                          } catch (Exception e) {

                                    throw new RuntimeException("Encountered exception while perform operation over the repository",e);

                          } finally {

                                    if (session != null) {

                                              session.logout();

                                    }

                          }

                      return "Total Rows Returned = " + blobsQueried + " total size = "+totalSize;

                }

      {code}

        • 1. Re: Memory leak/to much retained in WorkSpaceCache?
          bwallis42

          I tried a different dataset, 24395 nt:resource nodes in the tree with binary data attribute sizes of 1024 - 65536 randomly distributed and it made no different to the retained memory size so it doesn't seem to be related to the binary data attribute.


          Next I tried a simplified bit of code


          {code}

                                                  session = repository.login();

                                                  QueryManager queryManager = session.getWorkspace()

                                                                      .getQueryManager();

                                                  Query query = queryManager

                                                                      .createQuery(querystr, Query.JCR_SQL2);

                                                  log.info("Run Query = " + querystr);


                                                  QueryResult result = query.execute();

                                                  session.logout();

          {code}

          ie: just execute the query. Using the query string "select * from [nt:resource]" for the 24395 nt:resource nodes in my repository I see a growth in the heap usage (after doing a full GC) of 720MBytes.


          Am I supposed to be doing something with the result of the query to close it or release it or something?


          thanks.

          • 2. Re: Memory leak/to much retained in WorkSpaceCache?
            bwallis42

            I ran JBoss with YourKit profiler attached, ran the query "select * from [nt:resource]" against a pre-populated repository (with a couple of thousand nodes). The heap grew from about 40M to 100M (after a forced GC) and yourkit reports the following for "Biggest Objects (dominators)"


            dominators.jpg

            This never seems to be deallocated AFAIKT.


            Comparing the heap from before to after the query is run gives the following


            compared.jpg

            and having a look with the yourkit object explorer shows the following

            objectexplore.jpg

            Which seems to indicate that the workspace cache for the default workspace is holding onto 62MBytes of memory. From my experience with this and larger repositories it seems to be wanting to cache the whole repository contents

            • 3. Re: Memory leak/to much retained in WorkSpaceCache?
              rhauch

              Currently the workspace caches do accumulate in size and never get smaller. Obviously that's a critical issue, so I've logged MODE-1615. (I thought I had logged this before, but can't seem to find it and assume I never did.)