EJB subsystem thread-pool configuration
Hi,
I have a EJB subsystem configured on 7.1.1 Final like this:
<subsystem xmlns="urn:jboss:domain:ejb3:1.2">
<session-bean>
<stateless>
<bean-instance-pool-ref pool-name="slsb-strict-max-pool"/>
</stateless>
<stateful default-access-timeout="5000" cache-ref="simple"/>
<singleton default-access-timeout="5000"/>
</session-bean>
<pools>
<bean-instance-pools>
<strict-max-pool name="slsb-strict-max-pool" max-pool-size="20" instance-acquisition-timeout="5" instance-acquisition-timeout-unit="MINUTES"/>
<strict-max-pool name="mdb-strict-max-pool" max-pool-size="20" instance-acquisition-timeout="5" instance-acquisition-timeout-unit="MINUTES"/>
</bean-instance-pools>
</pools>
<caches>
<cache name="simple" aliases="NoPassivationCache"/>
</caches>
<passivation-stores>
<file-passivation-store name="file"/>
</passivation-stores>
<async thread-pool-name="default"/>
<timer-service thread-pool-name="default">
<data-store path="timer-service-data" relative-to="jboss.server.data.dir"/>
</timer-service>
<remote connector-ref="remoting-connector" thread-pool-name="default"/>
<thread-pools>
<thread-pool name="default">
<max-threads count="100"/>
<keepalive-time time="100" unit="milliseconds"/>
</thread-pool>
</thread-pools>
</subsystem>
My question is: How can I determine, if the pool size (max-threads count="100") is sufficient enough?
Here is a screenshot of JConsole:
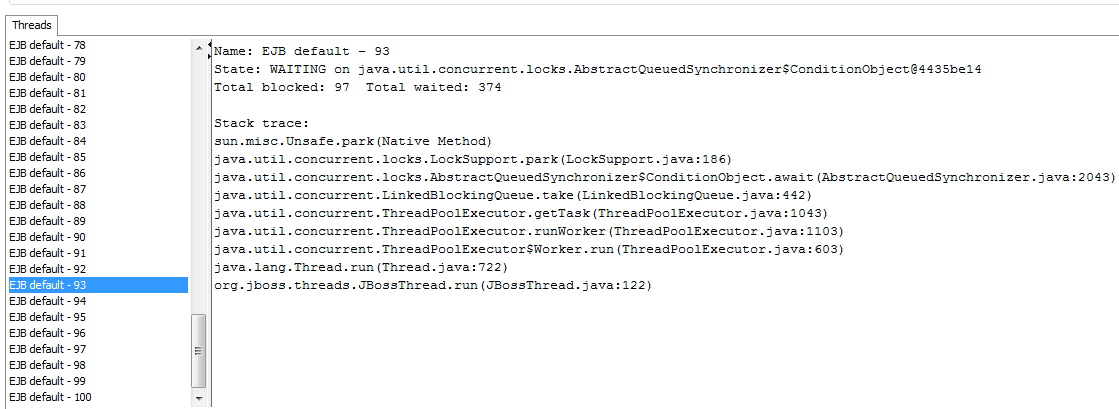
Does this stacktrace says anything about performance or wrong config of the EJB subsystem/thread pool?
I guess, every thread has the same state and is waiting on the same object.
What does it mean?
Thank you very much for any explanations!!!!