This content has been marked as final.
Show 12 replies
-
1. Re: JBoss 7.1.4 causes java.lang.OutOfMemoryError when an application is redeployed multiple times
lukascz Feb 21, 2013 10:16 AM (in response to lukascz)
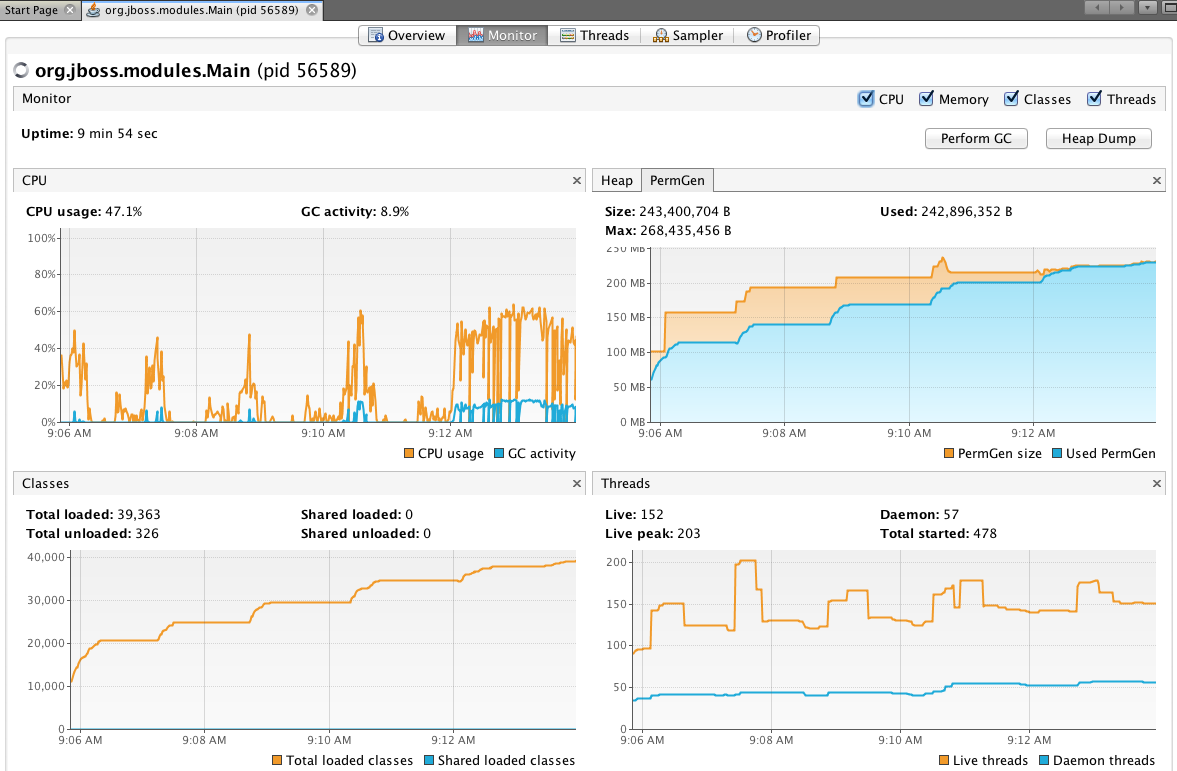
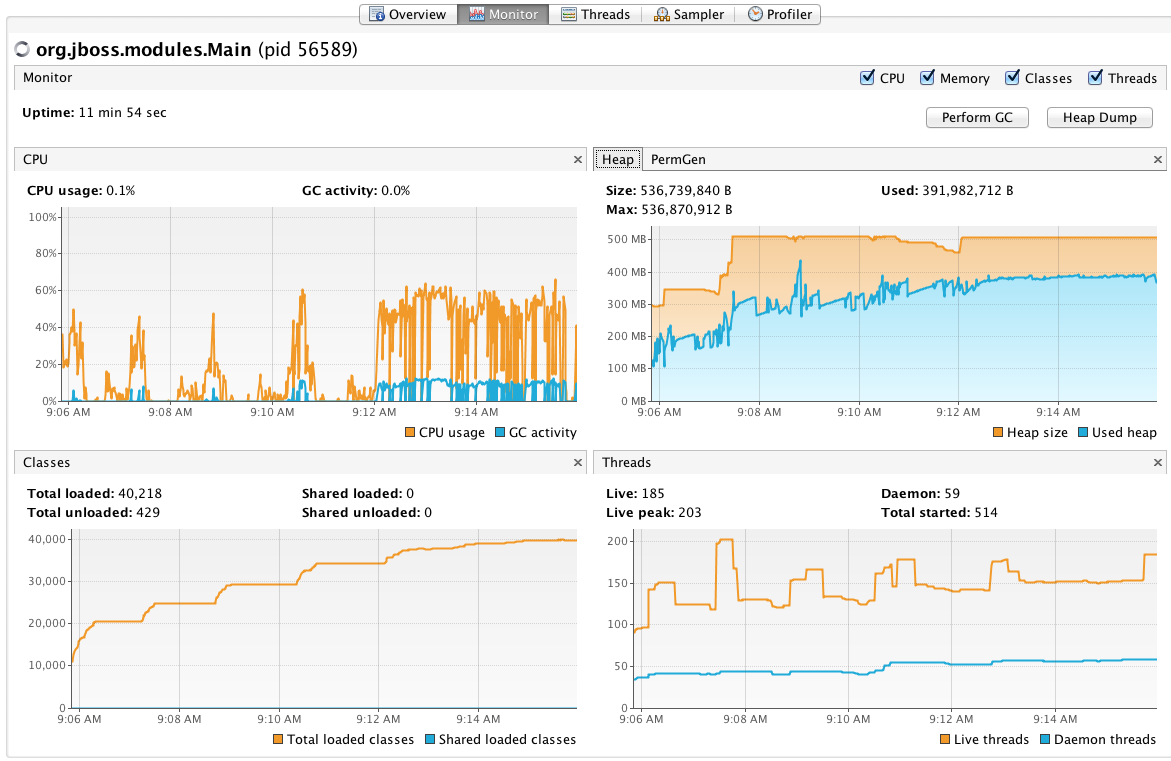
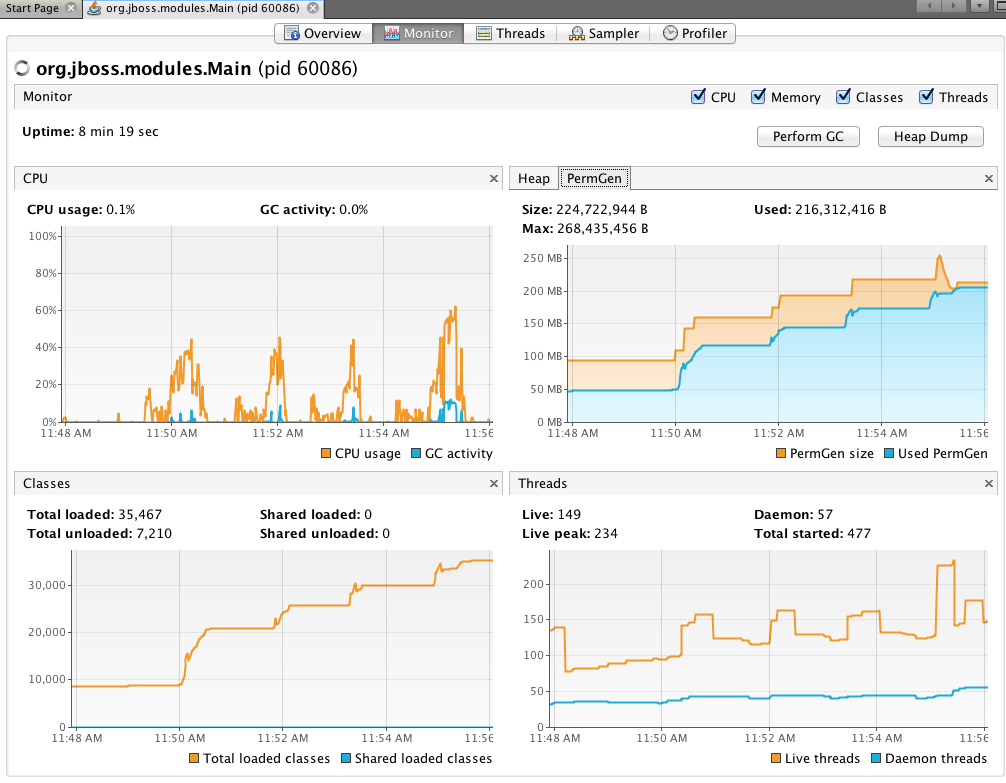
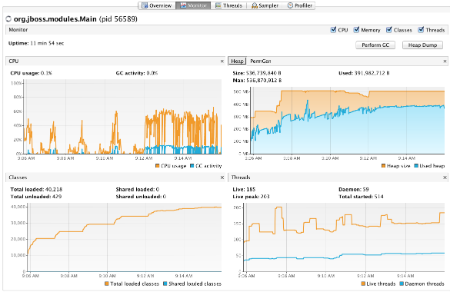
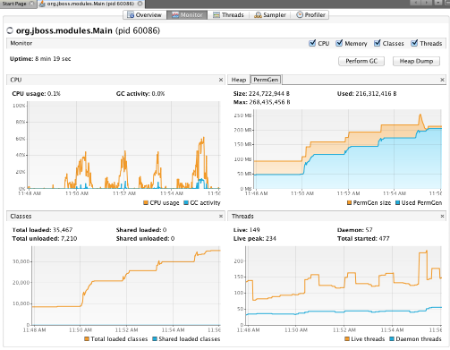
You can see the problem in the JVisualVM. Everytime I redeploy, you can see the increase in the perm size usage. Eventually, the permsize gets filled up by multiple redeployments
Heap seems to be ok
-
2. Re: JBoss 7.1.4 causes java.lang.OutOfMemoryError when an application is redeployed multiple times
smarlow Feb 21, 2013 10:16 AM (in response to lukascz)
The garbage collector is just warning you that, a certain number of garbage collections occurred in a short period of time, so you might need to increase the Java heap size. More realistically, just disable this checking via -XX:-UseGCOverheadLimit.
-
3. Re: JBoss 7.1.4 causes java.lang.OutOfMemoryError when an application is redeployed multiple times
smarlow Feb 21, 2013 10:18 AM (in response to lukascz)
For the permgen leaks, make sure your using the nightly AS build (not as interesting to looking the leak, if its already fixed).
-
4. Re: JBoss 7.1.4 causes java.lang.OutOfMemoryError when an application is redeployed multiple times
lukascz Feb 21, 2013 12:59 PM (in response to smarlow)
I just downloaded JBoss AS 8.0.0.Alpha1-SNAPSHOT "TBD". But I'm getting into the same troubles.
Is there something that could be wrong on application side that would cause this? I would assume that if JBoss undeploys an application, it will remove also all related resources from heap/PermGen space
Thanks,
Lukas
-
5. Re: JBoss 7.1.4 causes java.lang.OutOfMemoryError when an application is redeployed multiple times
ivom2gi Feb 22, 2013 2:08 AM (in response to lukascz)
Looking at the posted graphs it indeed looks like you are facing a permgen leak. I just finished debugging an application which contained no less than five of those beasts. Will be blogging about this next week, but meanwhile you can check about the permgen leaks from one of the earlier posts - http://plumbr.eu/blog/what-is-a-permgen-leak
-
6. Re: JBoss 7.1.4 causes java.lang.OutOfMemoryError when an application is redeployed multiple times
smarlow Feb 22, 2013 9:12 AM (in response to lukascz)
There are various tools that you can use to find the permgen leak cause and report the results back here. I have used the Eclipse Memory Analyzer tool in the past for finding the cause of memory leaks. Each one is different but as mentioned above, there are other tools that might make the process (of finding the leak) less labor intensive.
https://community.jboss.org/message/716191 is from the last time someone reported memory leaks, as you can see various issues were addressed.
Thanks for helping with these leaks. I don't care which tools you use to find the cause but please post screenshots showing the cause (as was done in the above link). If you hit a deadend trying to gather the (cause of leak) information, let us know that also. We can probably recommend an alternative way to gather the root cause(s) if that happens.
Scott
-
7. Re: JBoss 7.1.4 causes java.lang.OutOfMemoryError when an application is redeployed multiple times
lukascz Mar 13, 2013 12:31 PM (in response to smarlow)
Hi,
so I was digging into this issue in recent days I didn't find the reason. I use the Plumbr tool.
At first iteration the Plumbr recognized that 3 threads outlived the application when deployed/undeployed/deployed the application. Those were instances of org.jboss.threads.JBossThread and named "
default-threads - 1" or similarly. Later I found out that these 3 threads most likely represent 3 Message Driven Beans that I have in the application. So then I removed these beans from my applicaiton and started second iterations of experiments.
It turns out that the permgen is getting filled at the same pace, Plumbr at this point complains that there is one Thread that outlived the application:
The leaking classloader is being held by a thread named ClassLoader Thread. This thread has outlived the application that started it.
The thread runs an instance of:
org.jboss.modules.ConcurrentClassLoader$LoaderThread
It doesn't say anything more specific. So I don't really know what causes it.
Since it is leak in PermGen space, I cannot use some memory analyzer tool as PermGen space is not part of Heap Dump. I think the only thing I can do is to start trying to remove different components of my application and keep experimenting.
Also it's not only issue with my applicaiton. We also use XWiki applicaiton and it does the same thing - filling up the permgen space during repetitive deployment/undeployment.
I use the JBoss AS snapshot from February 21st, 2013.
-
8. Re: JBoss 7.1.4 causes java.lang.OutOfMemoryError when an application is redeployed multiple times
nikem Mar 13, 2013 12:41 PM (in response to lukascz)
Looking to the source of this org.jboss.modules.ConcurrentClassLoader$LoaderThread, one can see, that this thread is started by JBoss itself and runs in endless loop. And if something in your application triggered this thread into existence, it should kill it as well. I would ask for JBoss support or documentation for how this thread is meant to die.
Really, starting the thread and not providing clear way to stop it is asking for trouble to happen.
-
9. Re: JBoss 7.1.4 causes java.lang.OutOfMemoryError when an application is redeployed multiple times
kabirkhan Mar 13, 2013 12:48 PM (in response to lukascz)
ConcurrentClassLoader$LoaderThread is part of jboss modules, it is part of the AS bootstrap to avoid actual classloading happening from more than one thread. Whether or not it should be shut down I can't say, it might be left around to be able to load classes that would only need loading on shutdown. Anyway, that is very unlikely to be the cause of your problem. More likely one of the subsystems does not clean up things properly on undeploy, which would explain it. I think Eclipse Memory Analyzer could be good for tracking down the problem, although the 7.1 branch is dead so there will not be more releases there.
-
10. Re: JBoss 7.1.4 causes java.lang.OutOfMemoryError when an application is redeployed multiple times
nikem Mar 21, 2013 7:30 AM (in response to kabirkhan)
One easy to way to make it clear, if this ConcurrentClassLoader$LoaderThread is a real culprit or not follows:
While you perform the same test procedure as before, use VisualVM to monitor all running threads (on the next tab, named Threads). If there are more than one thread with the name "ClassLoader Thread" and especially if more and more of them appear during your run, then you can be pretty sure, that this is a JBoss's problem.
If JBoss spawns a thread on every application deploy and does not provide any hook to shut that thread down on application undeploy, then this is JBoss's bug.
-
11. Re: JBoss 7.1.4 causes java.lang.OutOfMemoryError when an application is redeployed multiple times
lukascz Mar 21, 2013 11:43 AM (in response to lukascz)
So what I did now was I start the server with deployed application and saved all the live threads. Then I undeployed it and deployed it again and I can see what threads were added with respect to the first deployment.
The only suspicious threads I can see are HornetQ threads. They never die and always new ones are created. That's strange though because for this experiment I removed all the java message beans from my application:
Thread-6 (HornetQ-server-HornetQServerImpl::serverUUID=8c9c4690-8e91-11e2-8afd-cb5d340f3b14-2099597535)
Thread-7 (HornetQ-server-HornetQServerImpl::serverUUID=8c9c4690-8e91-11e2-8afd-cb5d340f3b14-2099597535)
Thread-8 (HornetQ-server-HornetQServerImpl::serverUUID=8c9c4690-8e91-11e2-8afd-cb5d340f3b14-2099597535)
all these threads have following stack trace
"Thread-4 (HornetQ-client-global-scheduled-threads-1299621943)" daemon prio=5 tid=0x00007fccfb8b6000 nid=0x1c501d000 waiting on condition [0x00000001c501c000]
java.lang.Thread.State: WAITING (parking)
at sun.misc.Unsafe.park(Native Method)
- parking to wait for <0x00000001688120e8> (a java.util.concurrent.locks.AbstractQueuedSynchronizer$ConditionObject)
at java.util.concurrent.locks.LockSupport.park(LockSupport.java:186)
at java.util.concurrent.locks.AbstractQueuedSynchronizer$ConditionObject.await(AbstractQueuedSynchronizer.java:2043)
at java.util.concurrent.ScheduledThreadPoolExecutor$DelayedWorkQueue.take(ScheduledThreadPoolExecutor.java:1085)
at java.util.concurrent.ScheduledThreadPoolExecutor$DelayedWorkQueue.take(ScheduledThreadPoolExecutor.java:807)
at java.util.concurrent.ThreadPoolExecutor.getTask(ThreadPoolExecutor.java:1043)
at java.util.concurrent.ThreadPoolExecutor.runWorker(ThreadPoolExecutor.java:1103)
at java.util.concurrent.ThreadPoolExecutor$Worker.run(ThreadPoolExecutor.java:603)
at java.lang.Thread.run(Thread.java:722)
-
12. Re: JBoss 7.1.4 causes java.lang.OutOfMemoryError when an application is redeployed multiple times
jmesnil Mar 21, 2013 12:35 PM (in response to lukascz)
Lukas Camra wrote:
The only suspicious threads I can see are HornetQ threads. They never die and always new ones are created. That's strange though because for this experiment I removed all the java message beans from my application:
Thread-6 (HornetQ-server-HornetQServerImpl::serverUUID=8c9c4690-8e91-11e2-8afd-cb5d340f3b14-2099597535)
Thread-7 (HornetQ-server-HornetQServerImpl::serverUUID=8c9c4690-8e91-11e2-8afd-cb5d340f3b14-2099597535)
Thread-8 (HornetQ-server-HornetQServerImpl::serverUUID=8c9c4690-8e91-11e2-8afd-cb5d340f3b14-2099597535)
all these threads have following stack trace
"Thread-4 (HornetQ-client-global-scheduled-threads-1299621943)" daemon prio=5 tid=0x00007fccfb8b6000 nid=0x1c501d000 waiting on condition [0x00000001c501c000]
java.lang.Thread.State: WAITING (parking)
at sun.misc.Unsafe.park(Native Method)
- parking to wait for <0x00000001688120e8> (a java.util.concurrent.locks.AbstractQueuedSynchronizer$ConditionObject)
at java.util.concurrent.locks.LockSupport.park(LockSupport.java:186)
at java.util.concurrent.locks.AbstractQueuedSynchronizer$ConditionObject.await(AbstractQueuedSynchronizer.java:2043)
at java.util.concurrent.ScheduledThreadPoolExecutor$DelayedWorkQueue.take(ScheduledThreadPoolExecutor.java:1085)
at java.util.concurrent.ScheduledThreadPoolExecutor$DelayedWorkQueue.take(ScheduledThreadPoolExecutor.java:807)
at java.util.concurrent.ThreadPoolExecutor.getTask(ThreadPoolExecutor.java:1043)
at java.util.concurrent.ThreadPoolExecutor.runWorker(ThreadPoolExecutor.java:1103)
at java.util.concurrent.ThreadPoolExecutor$Worker.run(ThreadPoolExecutor.java:603)
at java.lang.Thread.run(Thread.java:722)
That looks suspiciously similar to https://issues.jboss.org/browse/HORNETQ-927 except it happens with HornetQ scheduled threads.
Do you use schedule JMS messages? is your AS7 instance part of a HornetQ cluster?