Infinispan 5.2.1: Very slow memory leak
Hi,
At my company we recently upgraded from our 1st Infinispan version (5.1.6) to version (5.2.1). We use Infinispan in the capacity of a Hotrod client-server usage and we use Infinispan as a remote cache cluster. We support a total of 9 caches and 6 of the 9 caches are not persistent - they are distributed using the following syntax in the XML configuration file. We find that from a day-to-day basis there is a small memory leak and the heap space available on the Infinispan JVM servers is little-by-little growing. This means that the objects on the heap are not being garbage collected approximately equal to the rate the are created over tine. Please help us uncover why this could be occurring and the resolution to solve this problem.
Details:
<namedCache name="ourCacheName">
<expiration
wakeUpInterval="500"
reaperEnabled="true"
lifespan="-1"
maxIdle="3600000"
/>
<clustering mode="distribution">
<sync/>
<hash numOwners="2"/>
</clustering>
</namedCache>
The 3 remaining caches are "persistent" and we use the following XML format for all 3:
<namedCache name="ourCache">
<loaders passivation="false" shared="false" preload="true">
<loader class="org.infinispan.loaders.file.FileCacheStore"
fetchPersistentState="true"
ignoreModifications="false"
purgeOnStartup="false">
<properties>
<property name="location" value="${infinispan.data.dir}"/>
</properties>
</loader>
</loaders>
<clustering mode="distribution">
<sync/>
<hash numOwners="2"/>
</clustering>
</namedCache>
Overall there are not 2 many entries in the non-persistent caches. In the persistent caches we do have 1 case where the cache has about 43,000 entries and they are loaded as static data (the hit ration is typically 100%).
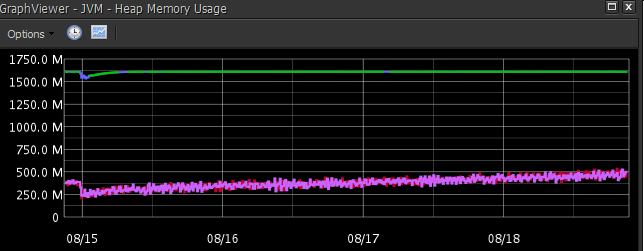
When we restart the Infinispan servers in our production environment the JVM Heap space is restored. We have 2 separate servers dedicated for Infinispan and there are 2 in production. Our cache hit rations are generally 90%+ and most of the caches have a hit ration of 99% - 100%.
However, as a retail company, our traffic will increase immensely in November and December. So we need to figure out the problem as soon as possible and correct it.
Can you help us narrow down how the memory leak could potentially be occurring? We are using JBoss 5.1.0 and our Infinispan server cluster (2 of them) sit on separate physical machines.
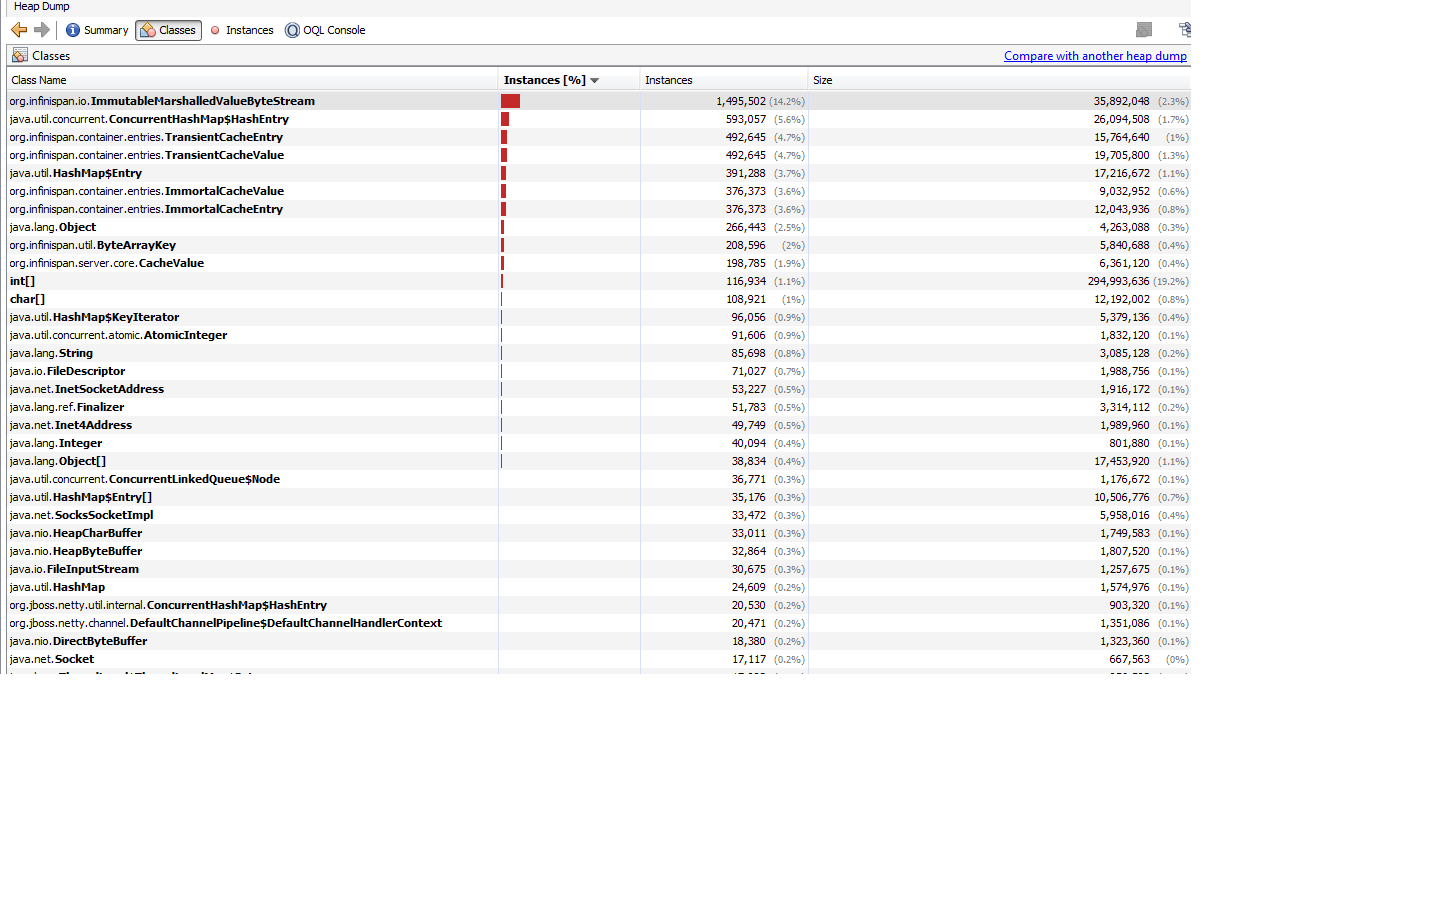
Here are images of the heap dumps as analyzed by Visual VM:
Screenshot 1 of 2: The highest occurring # of instances on the heap by % and #:
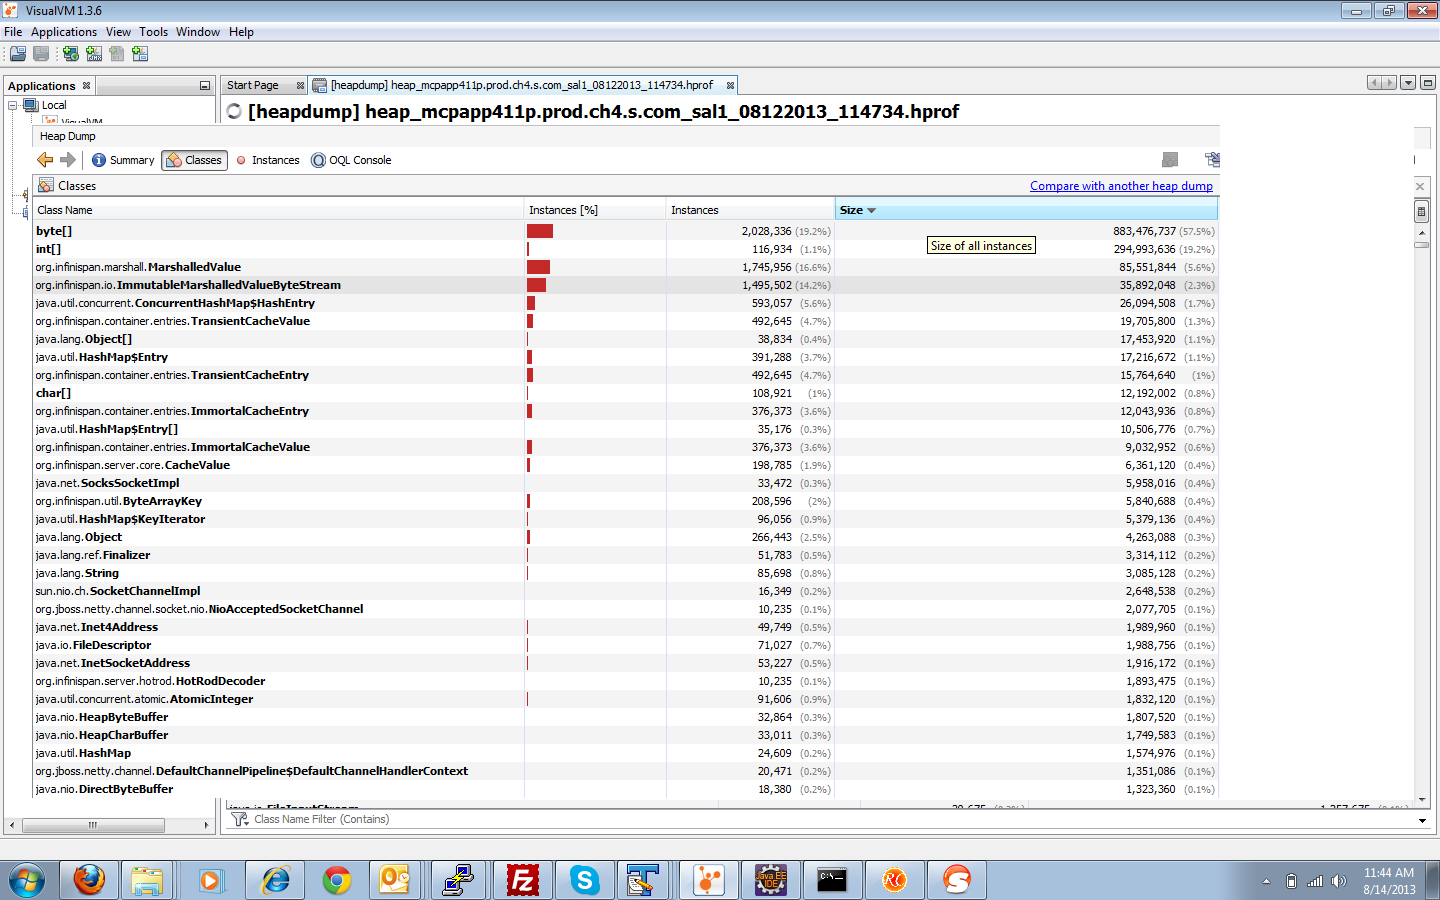
Screenshot 2 of 2: Instances that are consuming the most amount of space on the heap.