[Solved] Wildfly 8 Final - 100% cpu usage, no load, either due to Undertow's ServletPriterWriter or NIO CharsetEncoder
Hello everybody,
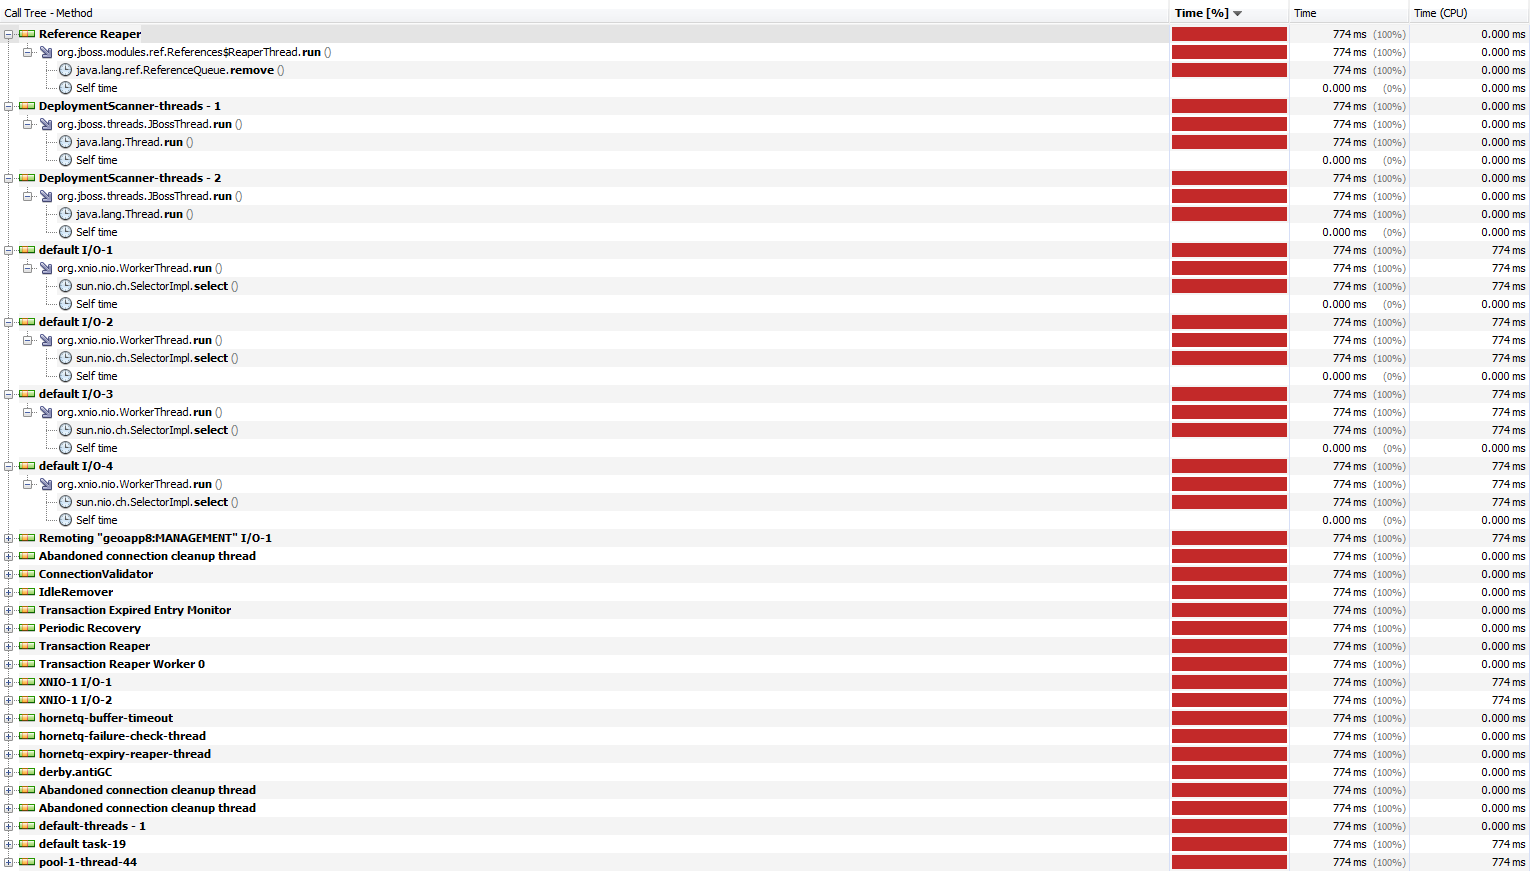
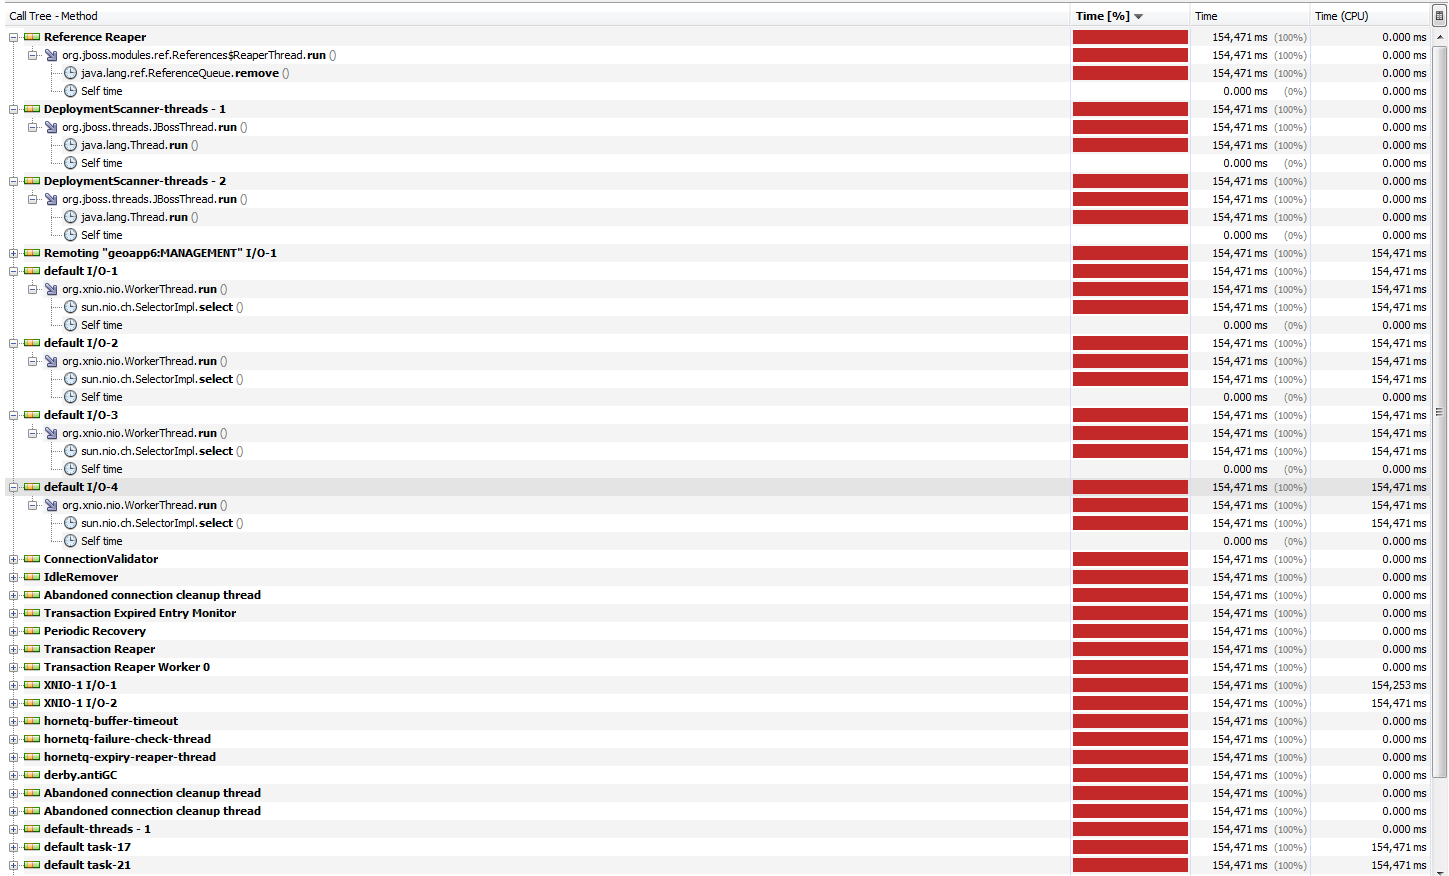
I've deployed a few Wildfly 8 Final servers and noticed that after a day or two the CPU usage goes to 100%. I was able to connect to servers with VisualVM and get some data:
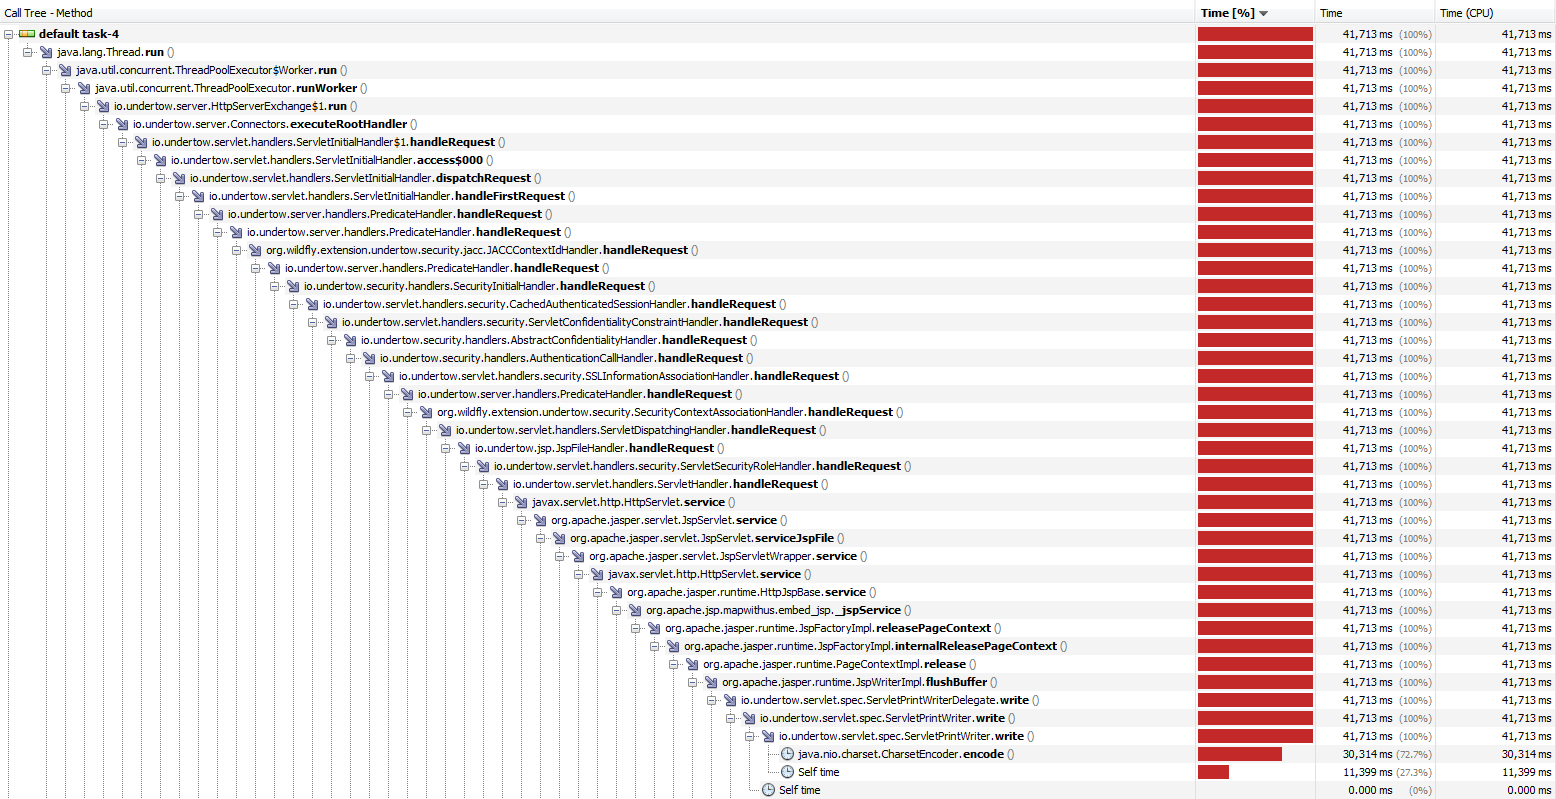
The thread dump for the "default task-4":
"default task-4" - Thread t@216
   java.lang.Thread.State: RUNNABLE
    at sun.nio.cs.UTF_8$Encoder.encodeBufferLoop(UTF_8.java:577)
    at sun.nio.cs.UTF_8$Encoder.encodeLoop(UTF_8.java:621)
    at java.nio.charset.CharsetEncoder.encode(CharsetEncoder.java:561)
    at io.undertow.servlet.spec.ServletPrintWriter.write(ServletPrintWriter.java:58)
    at io.undertow.servlet.spec.ServletPrintWriter.write(ServletPrintWriter.java:85)
    at io.undertow.servlet.spec.ServletPrintWriterDelegate.write(ServletPrintWriterDelegate.java:96)
    at org.apache.jasper.runtime.JspWriterImpl.flushBuffer(JspWriterImpl.java:120)
    at org.apache.jasper.runtime.PageContextImpl.release(PageContextImpl.java:191)
    at org.apache.jasper.runtime.JspFactoryImpl.internalReleasePageContext(JspFactoryImpl.java:115)
    at org.apache.jasper.runtime.JspFactoryImpl.releasePageContext(JspFactoryImpl.java:74)
    at org.apache.jsp.mapwithus.embed_jsp._jspService(embed_jsp.java:1618)
    at org.apache.jasper.runtime.HttpJspBase.service(HttpJspBase.java:69)
    at javax.servlet.http.HttpServlet.service(HttpServlet.java:790)
    at org.apache.jasper.servlet.JspServletWrapper.service(JspServletWrapper.java:366)
    at org.apache.jasper.servlet.JspServlet.serviceJspFile(JspServlet.java:326)
    at org.apache.jasper.servlet.JspServlet.service(JspServlet.java:259)
    at javax.servlet.http.HttpServlet.service(HttpServlet.java:790)
    at io.undertow.servlet.handlers.ServletHandler.handleRequest(ServletHandler.java:85)
    at io.undertow.servlet.handlers.security.ServletSecurityRoleHandler.handleRequest(ServletSecurityRoleHandler.java:61)
    at io.undertow.jsp.JspFileHandler.handleRequest(JspFileHandler.java:27)
    at io.undertow.servlet.handlers.ServletDispatchingHandler.handleRequest(ServletDispatchingHandler.java:36)
    at org.wildfly.extension.undertow.security.SecurityContextAssociationHandler.handleRequest(SecurityContextAssociationHandler.java:78)
    at io.undertow.server.handlers.PredicateHandler.handleRequest(PredicateHandler.java:25)
    at io.undertow.servlet.handlers.security.SSLInformationAssociationHandler.handleRequest(SSLInformationAssociationHandler.java:113)
    at io.undertow.security.handlers.AuthenticationCallHandler.handleRequest(AuthenticationCallHandler.java:52)
    at io.undertow.security.handlers.AbstractConfidentialityHandler.handleRequest(AbstractConfidentialityHandler.java:45)
    at io.undertow.servlet.handlers.security.ServletConfidentialityConstraintHandler.handleRequest(ServletConfidentialityConstraintHandler.java:61)
    at io.undertow.servlet.handlers.security.CachedAuthenticatedSessionHandler.handleRequest(CachedAuthenticatedSessionHandler.java:70)
    at io.undertow.security.handlers.SecurityInitialHandler.handleRequest(SecurityInitialHandler.java:76)
    at io.undertow.server.handlers.PredicateHandler.handleRequest(PredicateHandler.java:25)
    at org.wildfly.extension.undertow.security.jacc.JACCContextIdHandler.handleRequest(JACCContextIdHandler.java:61)
    at io.undertow.server.handlers.PredicateHandler.handleRequest(PredicateHandler.java:25)
    at io.undertow.server.handlers.PredicateHandler.handleRequest(PredicateHandler.java:25)
    at io.undertow.servlet.handlers.ServletInitialHandler.handleFirstRequest(ServletInitialHandler.java:240)
    at io.undertow.servlet.handlers.ServletInitialHandler.dispatchRequest(ServletInitialHandler.java:227)
    at io.undertow.servlet.handlers.ServletInitialHandler.access$000(ServletInitialHandler.java:73)
    at io.undertow.servlet.handlers.ServletInitialHandler$1.handleRequest(ServletInitialHandler.java:146)
    at io.undertow.server.Connectors.executeRootHandler(Connectors.java:168)
    at io.undertow.server.HttpServerExchange$1.run(HttpServerExchange.java:687)
    at java.util.concurrent.ThreadPoolExecutor.runWorker(ThreadPoolExecutor.java:1145)
    at java.util.concurrent.ThreadPoolExecutor$Worker.run(ThreadPoolExecutor.java:615)
    at java.lang.Thread.run(Thread.java:744)

   Locked ownable synchronizers:
    - locked <2e693b6c> (a java.util.concurrent.ThreadPoolExecutor$Worker)
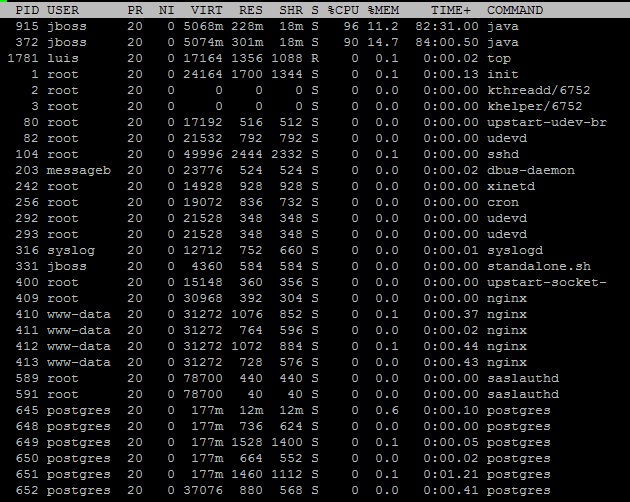
There's another task called "default task-6" that has exactly same thread dump. These machines have 2 cores, so one task takes 100% of core 1 and the other fully uses the other core, so CPU is under 100% load.
More details:
1) System setup:
OS Debian 7.4 Wheezy, 64 bit
JVM: Oracle 1.7 64-bit, version 51 (basically the latest)
CPU: 2 cores
RAM: 4GB (Wildfly gets 2048MB Xmx and Xms, 768MB permGen)
Wildfly: 8 Final
2) This does not happen on fresh restart; only after a day or two. When I look at CPU usage monitoring for those machines I can see that CPU usage went to 100% not instantly, but over a course of 3-5 hours (gradually increases to 100%).
3) The Wildfly machines are connected to outside via apache2 and AJP. Apache2 handles the SSL, not the Wildfly, so it is not the known issue/bug with Undertow and HTTPS.
4) I even thought that someone simply DDoSes servers and loading JSP pages causes high CPU load. So, I turned off just the apache (basically made it unavailable to public) and CPU usage remained at 100%. Therefore, it's not due to external load of any kind.
5) I have total of 8 machines with Wildfly 8 Final in standalone mode. All of them behave exactly like described above. Some start doing it earlier, some later. Some machines at first have 50% cpu usage (one core @100%), then after some time the second core goes to 100%.
6) The garbage collection CPU usage is low or close to 0% according to VisualVM.
How can this problem be solved? I couldn't find anything about this elsewhere online.
Finally, if any more information/debug is needed, I will be happy to provide it.