This content has been marked as final.
Show 3 replies
-
1. Re: JBoss 7.1.1 strange memory usage
wdfink Jun 12, 2014 3:59 PM (in response to festarbg)
Is the same happen if you start a fresh 7.1.1?
If not there should be some configuration or deployment which do something.
You might monitor threads and take thread dumps to see what is active
-
2. Re: JBoss 7.1.1 strange memory usage
festarbg Jun 13, 2014 4:43 AM (in response to wdfink)
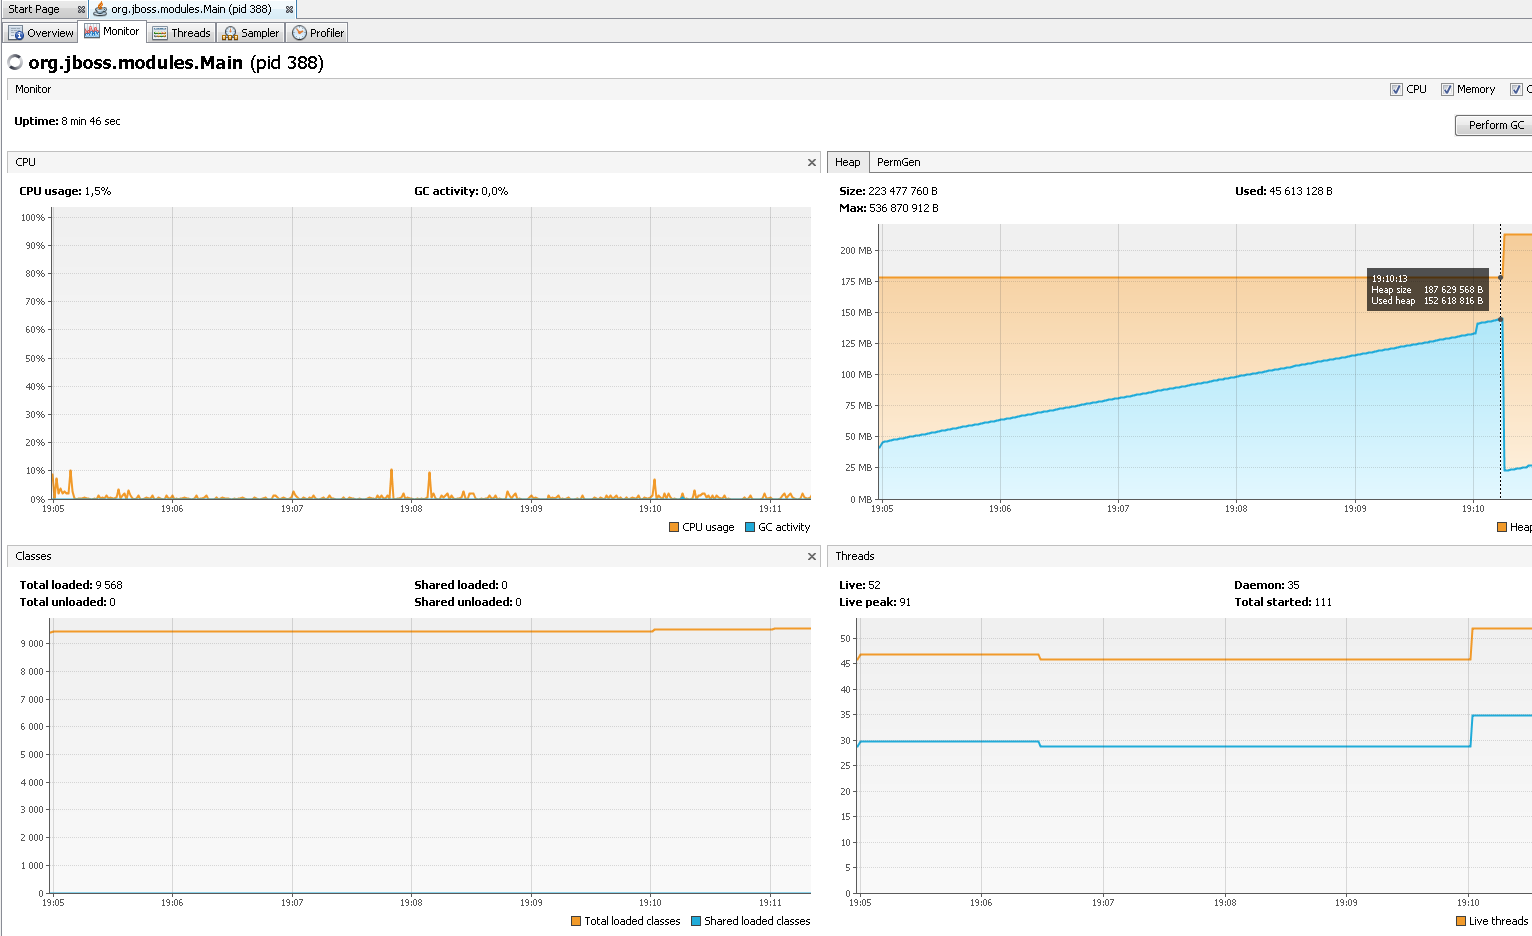
Yes, the same thing happens with a brand new and untouched JBoss installation (7.1.1. Final). This time the memory starts from 16M and goes to 80M and then again and again. Is this something I should be worried about (is it a wanted behaviour)?
-
3. Re: JBoss 7.1.1 strange memory usage
wdfink Jun 14, 2014 6:19 AM (in response to festarbg)
No, as if the server is idle there is still some activity and object are created. If the memory is not blown up and you did not see strong CPU use this is fine and a normal behaviour of Java applications