Call stacks of begin, enlistResource and commit
I have been looking at the call stacks used during the IronJacamar performance test suite. The test suite basically starts a transaction, get a connection, enlist the XAResource (behind the scenes), return the connection, and calls commit.
The XAResource sleeps 2 milliseconds in start(), and 10 milliseconds in commit() in order to simulate a round trip to the underlying Enterprise Information System. In reality those numbers are a lot bigger.
I have found 3 areas of discussion.
- Memory usage
- Performance of a single transaction
- Scaling
Main class in the performance suite is - ironjacamar/core/src/test/java/org/jboss/jca/core/tx/perf/Performance.java at 1.2 · ironjacamar/ironjacamar · GitHub
Memory usage
During enlistResource() a large portion of time is spent creating a Xid instance (createXid), and the associated byte[] array account for ~25% of memory used during the performance run.
The question is if the Narayana plugin for IronJacamar really needs to take a copy of the branch qualifier, or we can skip that step - ironjacamar/core/src/main/java/org/jboss/jca/core/tx/jbossts/XidWrapperImpl.java at 1.2 · ironjacamar/ironjacamar · GitH…
Lowering the pressure on the garbage collector would increase performance. Of course we could look at the actual createXid() hierarchy to see if improvements could be made there as well.
Another area is the BeanPopulartor.getNamedInstance(), which generates char[] arrays, but those are related to the TxStats.enabled - so they would go away if turned off. Maybe the enabled status could be cached in TxStats too ?
Performance of a single transaction
The begin(), enlistResource() and commit() hierarchies of course takes the most time in this scenario, but there are some areas that could be improved.
Some of the code is using older JDK datastructures - like Hashtable and Stack - that are expensive to create, so a newer datastructure could be of benefit - like [JBTM-2203] Use Deque for ThreadActionData by jesperpedersen · Pull Request #675 · jbosstm/narayana · GitHub
As to the Hashtable instances - they could likely all be replaced by Collections.synchronizedMap(new HashMap()) which is cheaper. But depending on the thread semantics of the class in question, maybe even HashMap or ConcurrentHashMap could be used. ConcurrentHashMap is expensive to create too, but offer benefits for certain use cases.
There are also unused code in the call stack that can be removed, like [JBTM-2203] Removed unused method from ActionManager by jesperpedersen · Pull Request #676 · jbosstm/narayana · GitHub
I'm also seeing a lot of thread management in some of the structures -- maybe the thread id (long) could be used instead to test for equality ?
Additional comments on the "synchronized" key words could be of benefit to gain an understanding of the internal sync points.
Scaling
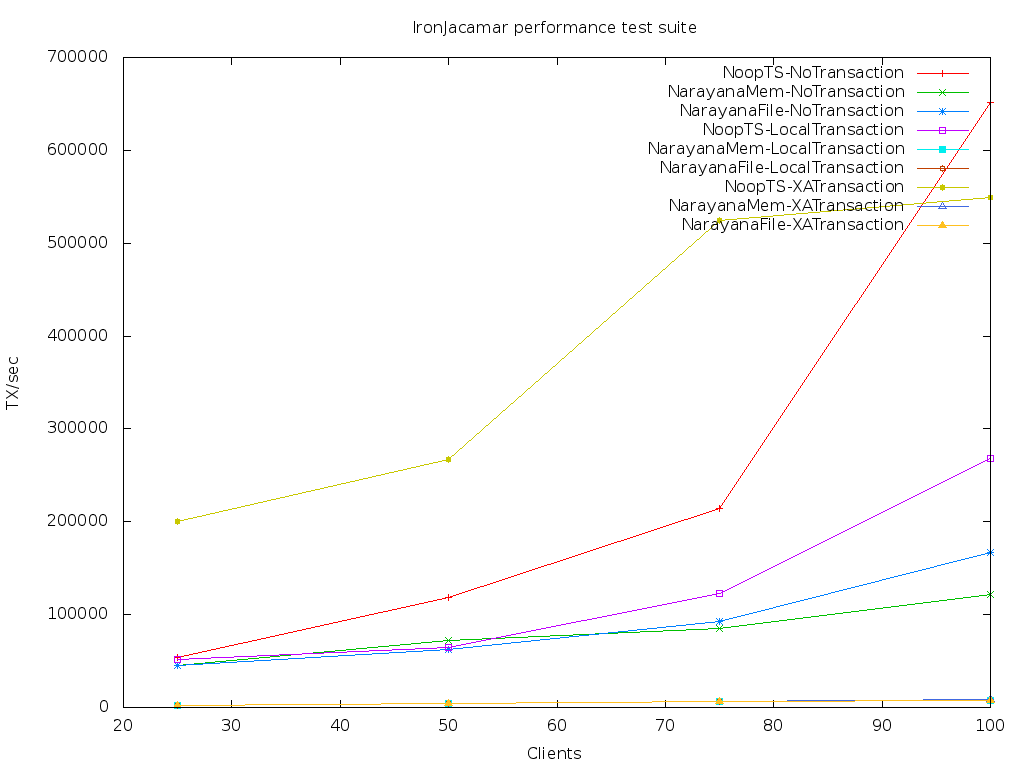
However, I'm currently blocked on what look to be a main lock somewhere, as the transactions per seconds drops as soon as there is a load on XAResource.start() and XAResource.commit() - e.g. the sleep is != 0. It doesn't seem to matter what the underlying storage implementation is, as both the memory store, and the file store gives the same numbers. But maybe my configuration needs to be adjusted,
Mem store - https://github.com/ironjacamar/ironjacamar/blob/1.2/embedded/src/main/resources/transaction.xml
File store - https://github.com/ironjacamar/ironjacamar/blob/1.2/core/src/test/resources/file-transaction.xml
The attached graph shows this -- the "missing" curves are on top of each other. Any ideas on this would be great.
As it is quite easy to do a run of the IronJacamar performance test suite I would be happy to do runs to verify patches, and take part in the discussions of my findings.
Side note, it would be nice to have checkstyle be part of the project, as it would be easier to submit patches that conforms to the project formatting rules. Also, -Dmaven.test.skip=true seems to be ignored for some modules, like JTS.
-
perf.png 14.6 KB