2 Replies Latest reply on Jan 4, 2015 10:46 PM by henry_g1

    RichFaces: Bar Chart changes x-axis order

    henry_g1

      I'm trying to implement a bar chart using the new Richfaces 4.5.1 chartSeries with each bar representing the sales for a month.  Unfortunately, the order of the months are not shown in chronological order.  I have outputted the "a4j:repeat" separately and that shows the months in the right order. Any ideas what I might be doing wrong?


      <h:panelGrid  id="salesgraphs" style="width:100%">

            <rich:chart id="barChart" title="Sales by Month" style="width:auto" rendered="#{storeManager.salesForYear.rowCount > 0}">

                 <rich:chartSeries type="bar">

                      <a4j:repeat value="#{storeManager.salesForYear}" var="record">

                           <rich:chartPoint x="#{record.monthName}" y="#{record.total}"/>

                      </a4j:repeat>

                 </rich:chartSeries>

                 <rich:chartXAxis label="Month" />

                 <rich:chartYAxis label="Total($)"/>

            </rich:chart>

      </h:panelGrid>


      public ListDataModel<List<SalesforMonth>> getSalesForYear () {

           if (salesforyear == null)

            salesforyear = new ArrayList<SalesforMonth>();

           if ((searchStartDate != null) && (searchEndDate != null)) {

                Date now = new Date();

                LocalDateTime minusAYear = LocalDateTime.now().minusYears(1);

                Date oneyearago = Date.from(minusAYear.toInstant(ZoneOffset.UTC));

               salesforyear = (List<SalesforMonth>)dataManager.getSalesPerMonthSearchResults(oneyearago, now);

           } else

                 log.error("Search criteria null");

           }


           salesforyearShown.setWrappedData(salesforyear);

            return this.salesforyearShown;

      }

        • 1. Re: RichFaces: Bar Chart changes x-axis order
          michpetrov

          I can't replicate it, I've fixed this issue in 4.5.1 and I don't see where it might be failing. Can you check the JavaScript output if the data are ordered correctly there?

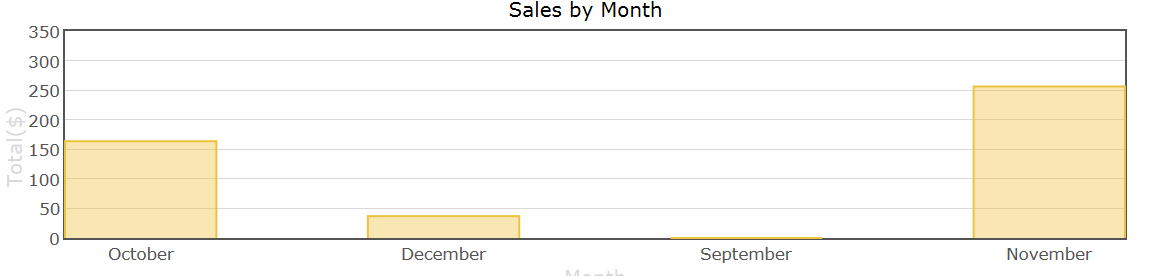
          • 2. Re: RichFaces: Bar Chart changes x-axis order
            henry_g1

            Here's the JavaScript:


            <td><div class=" chart-container" id="j_idt5:dashboard:barChart"><div class="chart-title">Sales by Month</div><div class="chart" id="j_idt5:dashboard:barChartChart"></div><script type="text/javascript">//


                                   new RichFaces.ui.Chart("j_idt5:dashboard:barChart", RichFaces.jQuery.extend({

                                                  handlers: RichFaces.jQuery.extend(),

                                                  particularSeriesHandlers: {"onplothover":[null],"onplotclick":[null]},

                                                  data: [{"data":{"October":163.68,"December":37.0875,"September":0,"January":19.296249999999997,"November":256.1291},"bars":{"show":true}}],

                                                 },

                                                 {"xaxis":{"axisLabel":"Month"},"xtype":"string","serverSideListener":false,"legend":{},"charttype":"bar","zoom":false,"ytype":"number","yaxis":{"axisLabel":"Total($)"}}

                                                ));

                         //</script></div></td>


            It's in the order shown in the chart.


            However, you clued me to what the problem is: I'm in fact using 4.5.0.  I'll update to 4.5.1 and try again.


            UPDATE: With the richfaces libs updated to 4.5.1 it works perfectly ... sorry about the oversight on my part and thanks for the help.