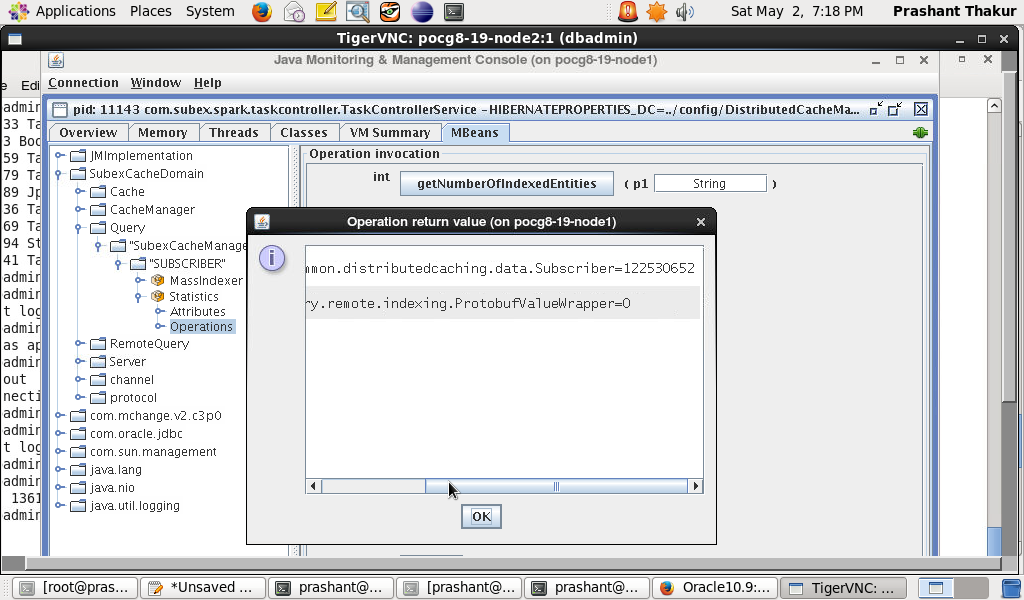
ProtobufValueWrapper, Hibernate Search and Slow Query performance
We are doing some benchmarking related to query performance of Infinispan in compatibiltiy mode.
Might not be the one giving the best performance number as radargun would give but the tests are more centered around how our applications would interact.
We have just one Node Holding Infinispan Data so network operations involved except for client in another box time to retreive data through hotrod.
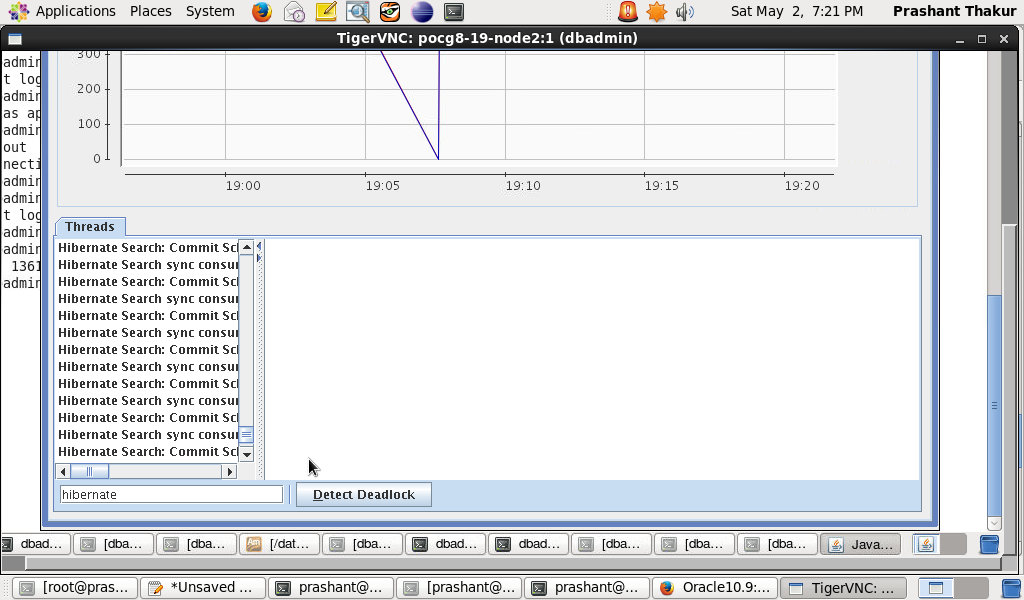
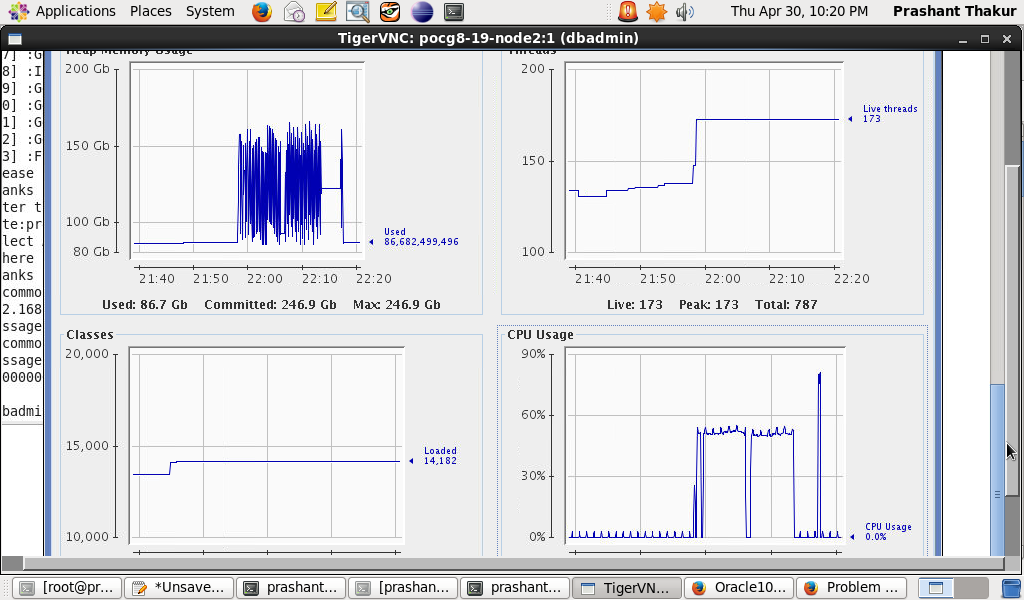
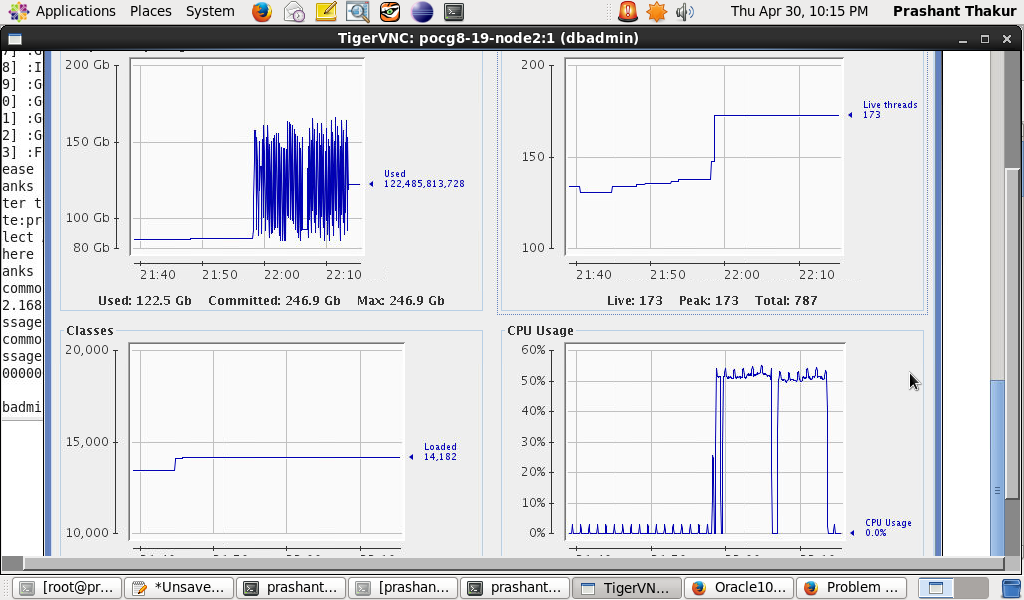
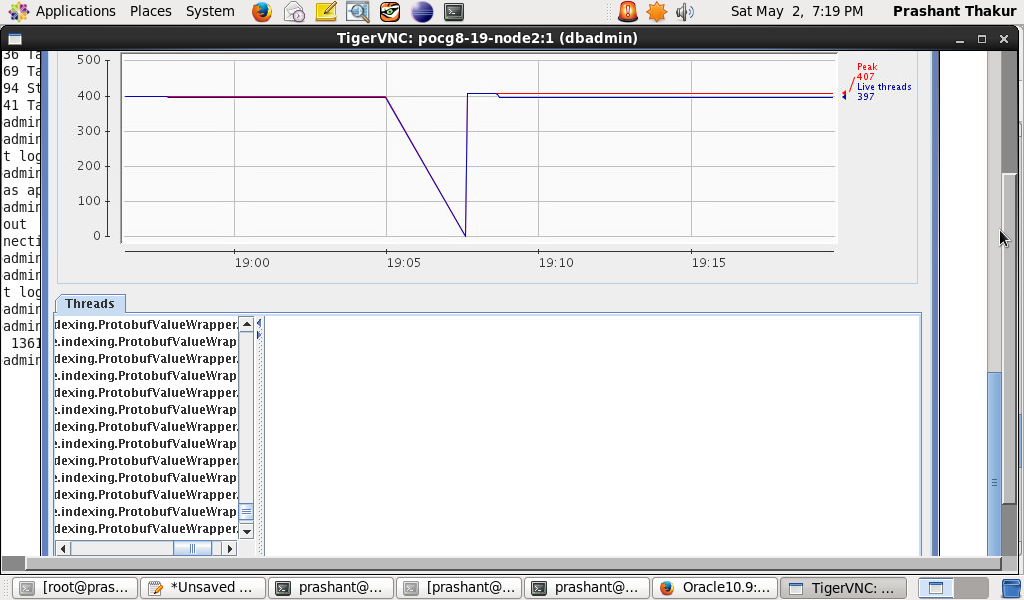
When I look at number of threads Hibernate threads are bloating up and CPU utlization is approx at 90% . I am basically unable to understand relation between Hibernate Search and ProtobufValueWrapper as we are in compatibility mode why is this wrapper coming into picture unless the data is being passed across to the remote client. If its remote client then it should only be ProtobufValueWrapper and not Hibernate Search if my understand is correct which obviously is confused .
Can you please explain this relation so that we can optimize somehow our query performance or suggest how it can be tuned ?
Coming to second part when we compare getwithVersion with Query results the difference is huge for same data set.
The performance with Get done on key is ~ 83 k and when same is used in Query it gives around 5k performance with 50 client threads.
This is approx 16x slower. Can you please suggest where we might be going wrong in using query module or this is an expected behaviour while using query module ?
The CPU utilization is also very high than expected.
We are attaching some JConsole Screenshots for reference.
There are 40 Server side threads on 16 core machine .
Please find below the test results for Subscriber for Query test
------------------------------------------------------------------------------------
------------------------------------------------------------------------------------
Record Count: 2000000, ThreadCount: 50, Starting Id: 9000000
(Internal Details) Batch Size: 2000, Task Count: 1000
Total Number of Records Processed - 2000000
Time taken for all records to be processed - 399 s
Average Number of Records Processed Per Second - 5012.0
Similar set up GET operations are as below
Record Count: 2000000, ThreadCount: 50, Starting Id: 9000000
(Internal Details) Batch Size: 2000, Task Count: 1000
Total Number of Records Processed - 2000000
Time taken for all records to be processed - 24 s
Average Number of Records Processed Per Second - 83333.0
-
Hibernate-Search.png 102.1 KB
-
Query-1.png 158.4 KB
-
Screenshot.png 150.2 KB
-
Screenshot-2.png 164.5 KB
-
threads-1.png 87.9 KB