CPU Spikes and phantom messages HornetQ Standalone
Hi,
We have been using HornetQ for a while, and yesterday we started suffering a problem. We use a 2.4.0-Final standalone clustered server, with this configuration for addresses:
<address-setting match="#">
<max-size-bytes>104857600</max-size-bytes>
<page-size-bytes>10485760</page-size-bytes>
<address-full-policy>PAGE</address-full-policy>
<redelivery-delay-multiplier>1.5</redelivery-delay-multiplier>
<redelivery-delay>5000</redelivery-delay>
<max-redelivery-delay>50000</max-redelivery-delay>
</address-setting>
<address-setting match="billing-platform-notifications">
<dead-letter-address>dead-letter</dead-letter-address>
<expiry-address>expired-msgs</expiry-address>
<redelivery-delay>1000</redelivery-delay>
<expiry-delay>259200000</expiry-delay>
</address-setting>
To explain a little bit the queue topology we have: we have many producers sending messages to the above address. Directly attached to that address we have 3 durable queues with different filters. We also have around 5 non-exclusive diverts that copy the messages in JMS addresses (each with one queue, obv).
At some point, the server started using a lot of CPU, and consumers started to consume very slowly. We killed the master to force a failover and a similar scenario happened in the other machine. We stopped the consumer processes, and forced the failover a couple more times until the situation stabilized, but with a weird effect. All queues showed some messages in the message count but those messages were not being consumed. Via JMX, we tried to move them to another queue, expire them, move them to deadletter with absolutely no effect (those operations reported 0 messages). We also tried to call the reset message counter operation, and nothing changed either.
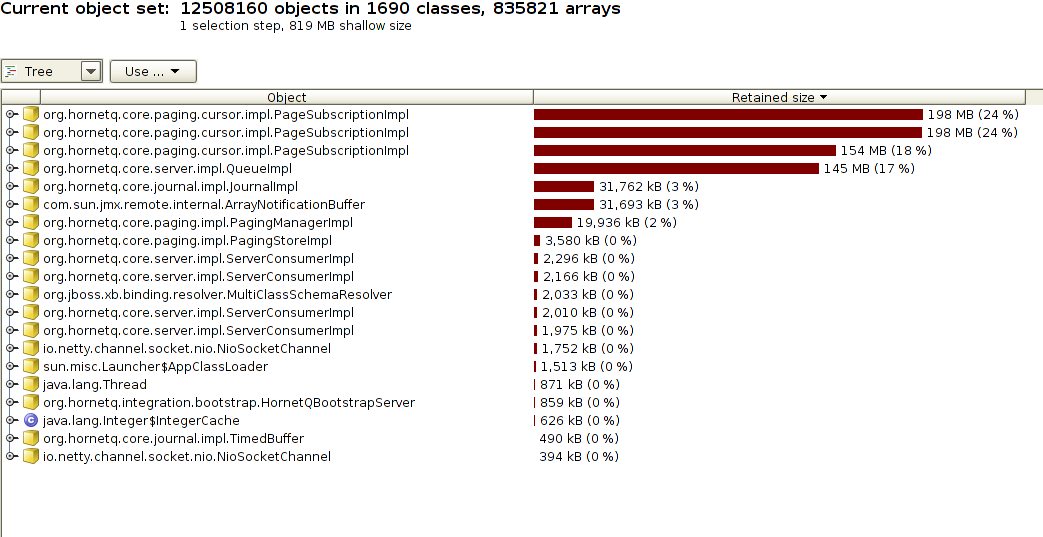
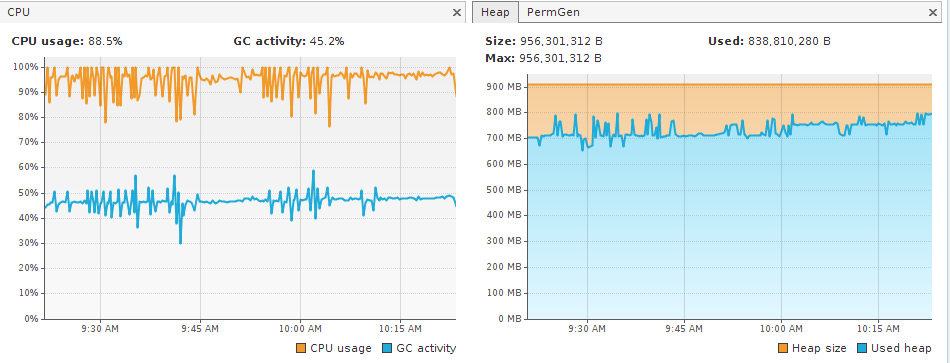
We were trying not to lose the messages, so as the situation was stabilized in terms of CPU usage, we decided to wait 3 days for the expiration time, to see if they would be expired and moved into the expiry-msgs queue, where we could process them and recover them. But last night, the instability start again, with a CPU spike. I'm attaching a thread dump, a heap dump and a snapshot of jvisualvm at the time. It looks like something is wrong with the Paging, since there are around 550MB in 3 instances of org.hornetq.core.paging.cursor.impl.PageSubscriptionImpl. You can see in jvisualvm that the GC is using a lot of CPU (stable around 50% CPU), but the old generation is not freed. It's nearly always at 90% capacity.
Is there anything we can do to understand what is the problem, and how to avoid it in the future?
Is there anything we can do to recover those messages?
Any other tip to break out of this situation?
Thanks,
Jesus.
-
hq-23432.stacktrace.zip 11.4 KB
-
heapdump_biggest_objects.png 86.1 KB
-
jvisualvm_hornetq.png 44.2 KB