-
15. Re: Out of memory with Clustered HornetQ
gabboflabbo Sep 17, 2015 1:04 PM (in response to jbertram)
Ok I've attached a more real test case. It's one war that takes a rest request and produces X messages to the queue. It also has 20 consumers that consume from the queue. I've put in a delay of 100ms on each of the consumers to simulate doing real work. With 20 consumers this comes out as 2000 msgs per sec per server which is around what I see in production.
On 2 wildfly instances with 1g of memory allocated:
1.) Start server A
2.) Start server B
3.) Visit the rest service on server A to start generating jms messages. For a 1g wildfly server, 1000000 will cause the server to break.
http://{serverA-ip}:{serverA-Port}/hornetq-clustering/rest/test/generate/1000000
3.) Visit the rest service on server B.
http://{serverB-ip}:{serverB-Port}/hornetq-clustering/rest/test/generate/1000000
Eventually both servers have memory issues.
It's important to note that if you run just one server the test above will run fine.. It's only when another clustered instance is online that this problem occurs.
-
hornetq-clustering2.zip 12.3 KB
-
-
16. Re: Out of memory with Clustered HornetQ
gabboflabbo Sep 17, 2015 1:19 PM (in response to jbertram)
instances are on the same machine. You just have to push harder to see it. This can be tuned, however, by setting the "direct-deliver" param on the in-vm acceptor you're using to "false". You can read more about the "direct-deliver" parameter in the documentation.
Wildfly seems to default that off (assuming this is the correct configuration):
<acceptors>
<http-acceptor http-listener="default" name="http-acceptor"/>
<http-acceptor http-listener="default" name="http-acceptor-throughput">
<param key="batch-delay" value="50"/>
<param key="direct-deliver" value="false"/>
</http-acceptor>
<in-vm-acceptor name="in-vm" server-id="0"/>
</acceptors>
I also played around with batch-delay but no luck.
So you're only getting 1,500 msgs/sec in your production tests with multiple producers and consumers?
That number is strictly the workload required to process the messages per server in a non-clustered environment. At the moment we've configured 60 consumers.
I wasn't referring to the flow control option. I was referring to my original assessment of your use-case. Here's what I said, "...that seems less than ideal from a performance and complexity-of-configuration standpoint. From a performance perspective you're basically doubling the amount of work necessary to get a message to your consumer since the message has to go to a local queue, get consumed by the bridge, then sent to the other server by the bridge where it is delivered to another queue. For durable messages that means the message would be written to and read from disk twice. If you simply sent the messages directly to the server B or had the consumers from server B read from server A the performance would be better. Such a change would also nullify the need for a cluster in the first place which would simplify your configuration." I emphasized the most relevant text. Aside from boosting the performance it would completely eliminate the problem you're seeing since it would remove the cluster bridge from the equation.
We want to be able to take down our consumers without stopping the receiving of messages through the rest api. The work per message is our bottleneck, not hornetq. The simplicity of just having our rest service push to the queue was why we choose this route. With the exception of this one issue, everything else has worked great.
-
17. Re: Out of memory with Clustered HornetQ
jbertram Sep 17, 2015 3:47 PM (in response to gabboflabbo)
It also has 20 consumers that consume from the queue. I've put in a delay of 100ms on each of the consumers to simulate doing real work. With 20 consumers this comes out as 2000 msgs per sec per server which is around what I see in production.
I'm a bit confused on your consumption numbers. One consumer using a delay of 100ms per message will be able to consume around 10 msgs/second (i.e. 1000/100=10). Therefore 20 such consumers will be able to consume around 200 msgs/second (i.e. 10*20=200). This is an order of magnitude less than 2,000 msgs/second. Is my math wrong?
Couple of additional questions...
- Why not use more than 20 consumers?
- Did you get a heap dump when the servers went OOM (assuming they did)? If so, where was the accumulation?
Hopefully I'll get a chance to look at your new example soon.
-
18. Re: Out of memory with Clustered HornetQ
jbertram Sep 17, 2015 3:54 PM (in response to gabboflabbo)
Wildfly seems to default that off (assuming this is the correct configuration):
<acceptors>
<http-acceptor http-listener="default" name="http-acceptor"/>
<http-acceptor http-listener="default" name="http-acceptor-throughput">
<param key="batch-delay" value="50"/>
<param key="direct-deliver" value="false"/>
</http-acceptor>
<in-vm-acceptor name="in-vm" server-id="0"/>
</acceptors>
I also played around with batch-delay but no luck.
It seems to, but it doesn't. If you take a closer look you'll see that no connection-factory actually uses the "http-connector-throughput" connector to connect to the "http-acceptor-throughput" acceptor. It's there to serve as an alternative to the "http-acceptor" but you'd need to actually change the relevant connection-factory to use the "http-connector-throughput" connector.
That said, since your application is running within the application server you should be using a connection-factory with an in-vm connector which means you should change the "in-vm" acceptor for your use-case.
-
19. Re: Out of memory with Clustered HornetQ
gabboflabbo Sep 18, 2015 11:48 AM (in response to jbertram)
It seems to, but it doesn't. If you take a closer look you'll see that no connection-factory actually uses the "http-connector-throughput" connector to connect to the "http-acceptor-throughput" acceptor. It's there to serve as an alternative to the "http-acceptor" but you'd need to actually change the relevant connection-factory to use the "http-connector-throughput" connector.
That said, since your application is running within the application server you should be using a connection-factory with an in-vm connector which means you should change the "in-vm" acceptor for your use-case.
So Wildfly 9 doesn't allow you to add that setting to the in-vm acceptor. Wildfly 10CR1 does, so I tested it out in that. However, I was not able to setup 2 wildfly 10CR1 instances on the same machine ( might be related to this: [WFLY-5308] Failed to start service due to IllegalStateException: Duplicate key during application deployment - JBoss … ). Or there's some other configuration change that's new in wildfly 10. Now, it's also using artemis instead of hornetq but maybe there's not too many differences yet?
I still experienced the same problem with the following:
                <in-vm-acceptor name="in-vm" server-id="0">
                    <param name="direct-deliver" value="false"/>
                </in-vm-acceptor>
Is there some way for me to test that that setting is being applied properly?
I'm a bit confused on your consumption numbers. One consumer using a delay of 100ms per message will be able to consume around 10 msgs/second (i.e. 1000/100=10). Therefore 20 such consumers will be able to consume around 200 msgs/second (i.e. 10*20=200). This is an order of magnitude less than 2,000 msgs/second. Is my math wrong?
Couple of additional questions...
- Why not use more than 20 consumers?
- Did you get a heap dump when the servers went OOM (assuming they did)? If so, where was the accumulation?
Hopefully I'll get a chance to look at your new example soon.
Ya the pause should have been 10ms not 100ms. For the 2 separate machine test, I removed the pause entirely and produced more messages than could be consumed and still ran into the same oom problem.
- Why not use more than 20 consumers?
We use 60 in our production. We found that to be the best number for performance. For the test I just left it as 20 as it didn't really matter.
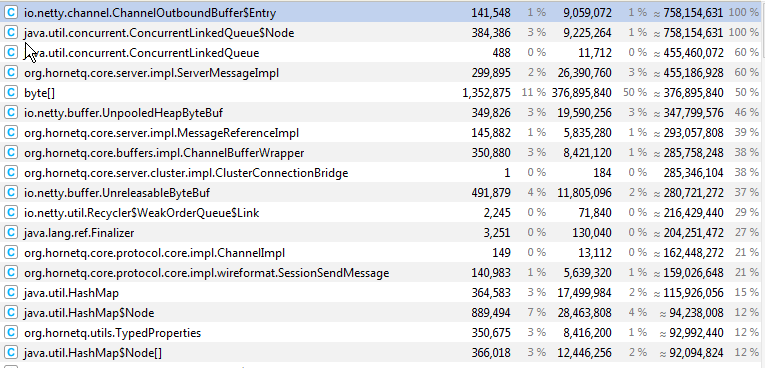
Did you get a heap dump when the servers went OOM (
I had a yourkit dump of a the over the network test. The main ones are
Class, Objects, Shallow Size, Retained Size
io.netty.channel.ChannelOutboundBuffer$Entry 152095 9734080 1116719480
org.apache.activemq.artemis.core.server.impl.ServerMessageImpl 429027 41186592 619950720
io.netty.buffer.UnpooledHeapByteBuf 500820 28045920 508807208
org.apache.activemq.artemis.core.buffers.impl.ChannelBufferWrapper 500831 12019944 443609552
I'll get a regular heap dump of the 2 servers on same machine in a few hours
-
20. Re: Out of memory with Clustered HornetQ
gabboflabbo Sep 18, 2015 2:16 PM (in response to jbertram)
Did you get a heap dump when the servers went OOM (assuming they did)? If so, where was the accumulation?
I've taken a snapshot of yourkit as the copy and paste does not work well.
This was from 2 clustered wildfly 9 ha servers on one physical box, 20 consumers each, posting 1 million messages to each server.
-
21. Re: Out of memory with Clustered HornetQ
jbertram Sep 18, 2015 5:33 PM (in response to gabboflabbo)
I finally got some time to try out your reproducer. Here's what I did:
- Unzipped a copy of Wildfly 9.0.1 into 2 directories.
- Unzipped your attached hornetq-clustering2.zip; ran 'mvn install'; copied the resulting hornetq-clustering2.war to the 'deployments' folder of both Wildfly instances.
- Copied your attached standalone-full-ha-serverA.xml and standalone-full-ha-serverB.xml to the corresponding 'configuration' directory of each Wildfly instance.
- Started instance A: ./standalone.sh -c standalone-full-ha-serverA.xml
- Started instance B: ./standalone.sh -c standalone-full-ha-serverB.xml -b 127.0.0.2 -bmanagement 127.0.0.2
- Opened http://127.0.0.1:8080/hornetq-clustering2/rest/test/generate/1000000 in a new browser tab
- Opened http://127.0.0.2:8080/hornetq-clustering2/rest/test/generate/1000000 in another new browser tab
Observations:
- I was surprised to see no memory problems. A million messages were sent on each server without an OOME.
- I did not adjust Wildfly's memory settings. It was using the default: -Xms64m -Xmx512m -XX:MaxPermSize=256m
- I did not adjust the direct-deliver flag so it was using the default value (i.e. true).
- When each REST call completed an exception was thrown because each call took longer than the default transaction timeout (i.e. 5 minutes) so when the container attempted to commit the implicit JTA transaction it failed since the timeout had rolled it back asynchronously. I recommend you disable transactions on the REST service itself.
- The attached RestService.java is creating the 'msgs' ArrayList with an initial capacity of 'total' (i.e. 1,000,000 in this case) which looks incorrect to me. I believe it should be using 'batchSize' instead. I have no idea if this is impacting the heap utilization, but it's probably worth correcting anyway.
Conclusion:
- I'm not sure where this leaves us. Do you see anything wrong with me testing methodology? If not, do you have any idea what might cause the discrepancy in our results?
-
22. Re: Out of memory with Clustered HornetQ
jbertram Sep 18, 2015 5:15 PM (in response to gabboflabbo)
By the way, I did some more investigating and I found that the "direct-deliver" flag only applies to Netty based acceptors so the recommendation to change that flag is moot.
-
23. Re: Out of memory with Clustered HornetQ
gabboflabbo Sep 18, 2015 6:04 PM (in response to jbertram)
Can you post the logs from one of the servers? Do the logs show a massive decrease in messages processed / queued?
What version of java are you using? And what OS?
I redid the entire test on a new machine (linux this time instead of windows). Following your steps exactly and downloading the files provided in this thread. Both servers end up slowing down to a crawl but I only saw an OOME from one of the servers.
17:57:38,749 INFO  [com.test.RestService] (default task-1) Queued 10000 messages (10000 total)
17:57:40,001 INFO  [com.test.StatLogger] (EJB default - 9) Messages processed: 170
17:57:40,422 INFO  [com.test.RestService] (default task-1) Queued 10000 messages (20000 total)
17:57:42,446 INFO  [com.test.RestService] (default task-1) Queued 10000 messages (30000 total)
17:57:43,129 INFO  [com.test.RestService] (default task-1) Queued 10000 messages (40000 total)
17:57:44,101 INFO  [com.test.RestService] (default task-1) Queued 10000 messages (50000 total)
17:57:44,620 INFO  [com.test.RestService] (default task-1) Queued 10000 messages (60000 total)
17:57:45,884 INFO  [com.test.RestService] (default task-1) Queued 10000 messages (70000 total)
17:57:46,521 INFO  [com.test.RestService] (default task-1) Queued 10000 messages (80000 total)
17:57:47,527 INFO  [com.test.RestService] (default task-1) Queued 10000 messages (90000 total)
17:57:48,815 INFO  [com.test.RestService] (default task-1) Queued 10000 messages (100000 total)
17:57:50,001 INFO  [com.test.StatLogger] (EJB default - 10) Messages processed: 731
17:57:50,895 INFO  [com.test.RestService] (default task-1) Queued 10000 messages (110000 total)
17:58:01,313 INFO  [com.test.StatLogger] (EJB default - 1) Messages processed: 140
17:58:10,501 INFO  [com.test.StatLogger] (EJB default - 2) Messages processed: 66
17:58:13,036 WARNING [org.jgroups.protocols.UDP] (INT-2,ee,dev-test01) JGRP000012: discarded message from different cluster hq-cluster (our cluster is ee). Sender was dev-test01 (received 91 identical messages from dev-test01 in the last 61133 ms)
17:58:15,530 WARNING [org.jgroups.protocols.UDP] (INT-2,hq-cluster,dev-test01) JGRP000012: discarded message from different cluster ee (our cluster is hq-cluster). Sender was dev-test01 (received 38 identical messages from dev-test01 in the last 63428 ms)
17:58:15,532 INFO  [com.test.RestService] (default task-1) Queued 10000 messages (120000 total)
17:58:16,320 WARNING [org.jgroups.protocols.UDP] (INT-2,ee,dev-test01) JGRP000012: discarded message from different cluster hq-cluster (our cluster is ee). Sender was dev-test01 (received 87 identical messages from dev-test01 in the last 60720 ms)
17:58:16,322 WARNING [org.jgroups.protocols.UDP] (INT-1,hq-cluster,dev-test01) JGRP000012: discarded message from different cluster ee (our cluster is hq-cluster). Sender was dev-test01 (received 26 identical messages from dev-test01 in the last 60719 ms)
17:58:20,451 INFO  [com.test.StatLogger] (EJB default - 3) Messages processed: 89
17:58:30,808 INFO  [com.test.StatLogger] (EJB default - 4) Messages processed: 33
17:58:35,235 INFO  [com.test.RestService] (default task-1) Queued 10000 messages (130000 total)
17:58:42,091 INFO  [com.test.StatLogger] (EJB default - 5) Messages processed: 120
17:59:00,187 ERROR [org.jboss.as.controller.management-operation] (DeploymentScanner-threads - 2) WFLYCTL0013: Operation ("read-children-resources") failed - address: ([]): java.lang.OutOfMemoryError: GC overhead limit exceeded


17:59:00,187 ERROR [org.hornetq.core.client] (Thread-14 (HornetQ-server-HornetQServerImpl::serverUUID=12c0601f-5e50-11e5-a220-c725a3d24a41-2073481293)) HQ214017: Caught unexpected Throwable: java.lang.OutOfMemoryError: GC overhead limit exceeded

17:58:57,060 SEVERE [org.jgroups.util.TimeScheduler3] (Timer runner-1,ee,dev-test01) failed submitting task to thread pool: java.lang.OutOfMemoryError: GC overhead limit exceeded
        at java.util.concurrent.LinkedBlockingQueue.offer(LinkedBlockingQueue.java:415)
        at java.util.concurrent.ThreadPoolExecutor.execute(ThreadPoolExecutor.java:1364)
        at org.jgroups.util.TimeScheduler3.submitToPool(TimeScheduler3.java:198)
        at org.jgroups.util.TimeScheduler3.run(TimeScheduler3.java:163)
        at java.lang.Thread.run(Thread.java:745)

17:58:51,840 SEVERE [org.jgroups.JChannel] (Incoming-16,hq-cluster,dev-test01) JGRP000019: failed passing message to receiver: java.lang.OutOfMemoryError: GC overhead limit exceeded
If you are hitting the 5 minutes for posting 1,000,000 messages then it sounds like the server is slowing down.
For instance, with just one server running it takes about ~30 seconds to post 1million messages
17:52:38,260 INFO  [com.test.RestService] (default task-2) Queued 10000 messages (10000 total)
...<snip>
17:53:05,622 INFO  [com.test.RestService] (default task-2) Queued 10000 messages (1000000 total)
I'll try some more debugging, I'm not sure what else could be different.
-
24. Re: Out of memory with Clustered HornetQ
jbertram Sep 21, 2015 3:53 PM (in response to gabboflabbo)
What version of java are you using?
$ java -version
java version "1.8.0_60"
Java(TM) SE Runtime Environment (build 1.8.0_60-b27)
Java HotSpot(TM) 64-Bit Server VM (build 25.60-b23, mixed mode)
And what OS?
$ uname -a
Linux workhorse 3.13.0-63-generic #103-Ubuntu SMP Fri Aug 14 21:42:59 UTC 2015 x86_64 x86_64 x86_64 GNU/Linux
Can you post the logs from one of the servers? Do the logs show a massive decrease in messages processed / queued?
In order to get clean logs I had to run the test again. However, since you mentioned how much faster it goes with just one node I tried that out first and I see the performance discrepancy you're talking about. I'm also seeing heap issues that I didn't see in my initial runs. I'm investigating further.
-
25. Re: Out of memory with Clustered HornetQ
jbertram Sep 24, 2015 2:00 PM (in response to jbertram)
I did some investigation and here are my thoughts:
- In a HornetQ cluster messages are distributed round-robin around the cluster. In a cluster of 2 nodes that means every other message produced on a node will be distributed to the other node in the cluster (e.g. produce 1,000,000 messages on node A and 500,000 of those messages will be sent across the cluster bridge to node B and vice-versa).
- The cluster bridge is designed for high performance and not necessarily low memory utilization. It consumes messages and sends them as quickly as possible. By default the sending operation doesn't block and wait for an acknowledgement of the send from the remote target. Instead, it keeps a record of the messages sent and receives the acknowledgements asynchronously from the remote target at which point it removes the acknowledged message from its record. As you have seen, this design choice can lead to the accumulation of messages in memory when the bridge doesn't receive acknowledgements as quickly as it sends messages.
- There are a few ways I see to work within the current design given your use-case.
- Move to Artemis where message load-balancing can be disabled. See the "message-load-balancing" parameter in the Artemis documentation.
- Tune the performance of the cluster bridge. I switched my cluster-connection to the use the http-throughput-connector for my tests, and I haven't seen another OOME.
- Give the JVM more memory. A heap size of 1G is pretty small these days. My Java IDE uses more than that.
- Using HornetQ's large message support may work better for your use-case. My idea here is that instead of generating thousands of small messages per REST call you could create just 1 large message with the contents of all the smaller messages. That would reduced the memory utilization because large messages are treated specially and are never fully loaded into memory but rather dealt with in chunks. I think it would also eliminate your requirement to group messages. You can read more about HornetQ's large message support in the documentation.
-
26. Re: Out of memory with Clustered HornetQ
gabboflabbo Oct 1, 2015 10:23 AM (in response to jbertram)
Thanks for your help. We'll experiment with some of the options. I think our end plan may revolve around using large message for the initial queue then have another queue of individual messages (but block instead of page).
