This content has been marked as final.
Show 5 replies
-
1. Re: Monitor heap space
pathduck Mar 31, 2016 7:17 AM (in response to karthikraj)
Hi,
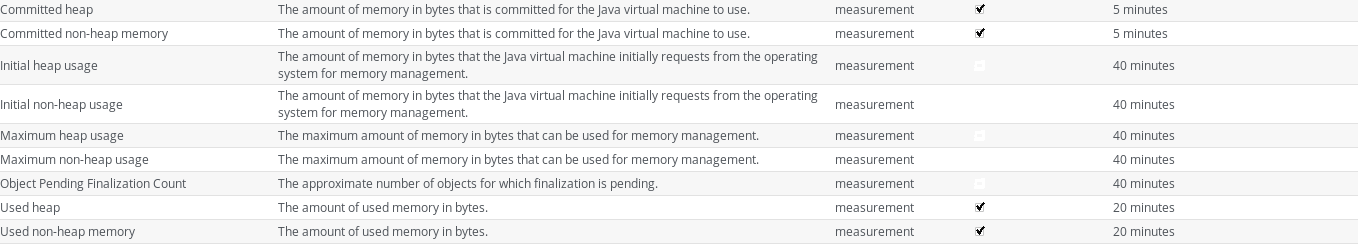
the defaults are fine, and I don't really see the need to monitor "commited heap" just Used Heap/Non-heap.
Non-heap memory is basically Permgen, and while permgen leaks are rare, it does happen so it's good to watch.
However, RHQ/JON does not offer to set alerts based on % used of max.heap, so creating alerts based on heap usage is difficult if you have more than a handful of servers, or they are all the same application with the same Xmx values.
A better approach is to monitor (and set alerts) on GC Overhead which you can find in Platform-mbean > garbage-collector > Garbage Collector Resource. Collection Time/Minute is the metric you are interested in. A high value here means your JVM is using too much time in GC, so the heap is probably getting filled.
-
2. Re: Monitor heap space
jayshaughnessy Mar 31, 2016 10:29 AM (in response to pathduck)
> However, RHQ/JON does not offer to set alerts based on % used of max.heap, so creating alerts based on heap usage is difficult if you have more than a handful of servers, or they are all the same application with the same Xmx values.
Stian,
Just as an FYI, this is an alerting weakness we've addressed in the Hawkular Alerts project. Hawkular Alerts is an alerting component that takes what we learned in RHQ and then goes further. Hawkular Alerts is used inside Hawkular but is a standalone project as well. It can add alerting and event handling to any project. If, for example, you wanted to perform %ofMaxHeapUsed alerting it could be done by feeding the UsedHeap and MaxHeap metrics into Hawkular Alerts (via REST API) and defining the appropriate Trigger. Hawkular Alerts 1.0 has been released. For more see hawkular.org, hawkular/hawkular_alerts on github, or find us on freenode, #hawkular.
-
3. Re: Monitor heap space
karthikraj Apr 1, 2016 2:23 AM (in response to pathduck)
Hello Stian,
Thanks for your advice
Actually we have 28 groups (52 nodes) in one of our environments.All the groups have different xms and xmx values.
Our requiremnet is to monitor memory usage of all the nodes so i decided to go with used heap and max heap
As you mentioned : "A better approach is to monitor (and set alerts) on GC Overhead which you can find in Platform-mbean > garbage-collector > Garbage Collector Resource. Collection Time/Minute"Is it enough to watch the metric you have mentioned??
-
4. Re: Monitor heap space
karthikraj Apr 1, 2016 3:14 AM (in response to karthikraj)
Also Please give me an idea about collection count ( total number of collections that have occurred) I am not sure what are the values it going to collect from GC
-
5. Re: Monitor heap space
pathduck Apr 1, 2016 5:53 AM (in response to jayshaughnessy)
jay shaughnessy wrote:
Stian,Just as an FYI, this is an alerting weakness we've addressed in the Hawkular Alerts project. Hawkular Alerts is an alerting component that takes what we learned in RHQ and then goes further. Hawkular Alerts is used inside Hawkular but is a standalone project as well. It can add alerting and event handling to any project. If, for example, you wanted to perform %ofMaxHeapUsed alerting it could be done by feeding the UsedHeap and MaxHeap metrics into Hawkular Alerts (via REST API) and defining the appropriate Trigger. Hawkular Alerts 1.0 has been released. For more see hawkular.org, hawkular/hawkular_alerts on github, or find us on freenode, #hawkular.
Thanks Jay, let's just say I've been keeping a hawk's eye (geddit?) on Hawkular lately. It's still early days, and still it seems very developer-centric in that it is very focused on devops and creating your own REST calls and so on to do stuff. Very Cool for developers but for us OPS guys we want something that works more out of the box with a UI to define stuff, lazy buggers that we are
(not that we don't mind coding some scripts, not just Java development, more concerned about keeping the damned things running smoothly).
karthikraj : Collection Count is the number of garbage-collections that have occured since the JVM start. Not very useful but you could for instance use it for baseline metrics, for instance if number of GC rises sharply over a period.
As to the max. heap values I think the values reported by RHQ are the size of the expanded heap, and not necessarily the actual size of Xmx given to java. So for alerting it wouldn't do much good.
Once a baseline is established you could potentially alert on major changes in heap used, but you would expect a lot of false positives until tuning it properly.