This content has been marked as final.
Show 1 reply
-
1. Re: JAVA HEAP MEMORY
pathduck Mar 31, 2016 7:45 AM (in response to karthikraj)
What are the Xmx settings for your servers? Are they all the same?
What are the Xms (inital heap) values?
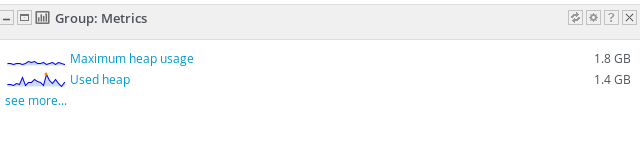
I think that like you say, Group Metrics are an average of the values over the time interval you have chosen for this dashboard. Not really sure on the details, I've been confused on this point as well.
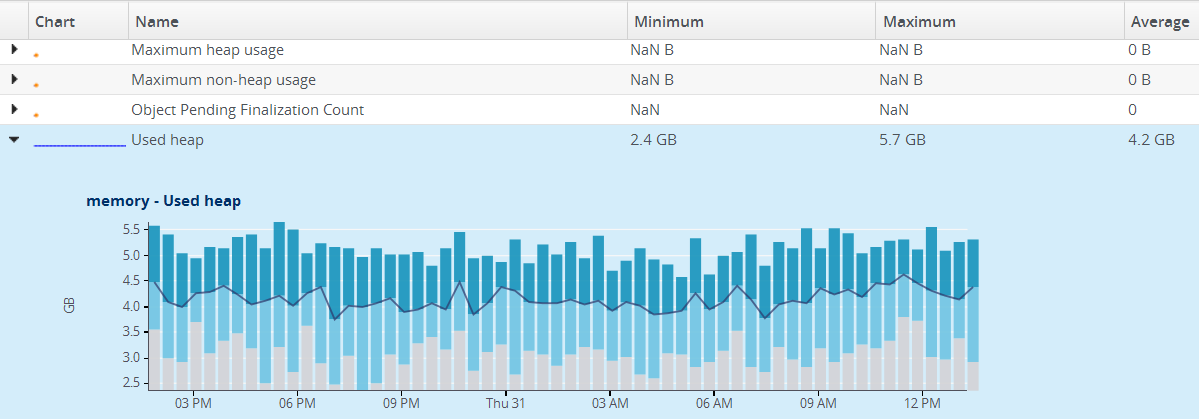
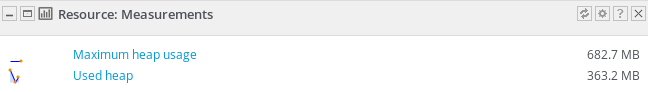
Note that Maximum Heap Usage is defined as "The maximum amount of memory that can be used for memory management.". I would assume that since Java will expand the allocated memory (up to the Xmx value), you will see different values dependent on how much memory load each server has. So you might see some servers using 600 and some 1.8GB.
Note also that expansion of heap is a CPU-expensive operation, so you might want to ensure all your servers have the same amount of load to spread it out.
For instance, here are the used heap values from a group of six servers in production. The Used Heap value in the dashboard portlet was 4.4GB so I assume this is the Average value.