HornetQ sync leads to IO overload
Hello,
We have a Wildfly 8.2.0 cluster in Amazon (ubuntu 14.04, approx. 20 nodes). HornetQ has default configuration (standalone-full-ha.xml)
Sometimes on one node (not at concrete one, it can be any) we see spontaneous leap on our CPU graph. CPU iotime goes up.
It can happen at any time, on any node in the cluster.
In most of cases CPU io utilization goes to 80-100% and messages become stuck at the node. Message count grows - consumers don't process messages anymore. After restart everything works fine.
Periodically we see that another side of the issue: iotime goes to 8-15% and doesn't fall down until restart, but everything works fine.
But all of this has the same look in thread dumps:
Thread 11829: (state = IN_NATIVE)
- sun.nio.ch.FileDispatcherImpl.force0(java.io.FileDescriptor, boolean) @bci=0 (Compiled frame; information may be imprecise)
- sun.nio.ch.FileDispatcherImpl.force(java.io.FileDescriptor, boolean) @bci=2, line=76 (Compiled frame)
- sun.nio.ch.FileChannelImpl.force(boolean) @bci=80, line=376 (Compiled frame)
- org.hornetq.core.journal.impl.NIOSequentialFile.sync() @bci=12, line=238 (Compiled frame)
- org.hornetq.core.journal.impl.NIOSequentialFile.doInternalWrite(java.nio.ByteBuffer, boolean, org.hornetq.core.journal.IOAsyncTask) @bci=14, line=407 (Compiled frame)
- org.hornetq.core.journal.impl.NIOSequentialFile.access$000(org.hornetq.core.journal.impl.NIOSequentialFile, java.nio.ByteBuffer, boolean, org.hornetq.core.journal.IOAsyncTask) @bci=4, line=40 (Compiled frame)
- org.hornetq.core.journal.impl.NIOSequentialFile$1.run() @bci=16, line=371 (Compiled frame)
- java.util.concurrent.ThreadPoolExecutor.runWorker(java.util.concurrent.ThreadPoolExecutor$Worker) @bci=95, line=1145 (Compiled frame)
- java.util.concurrent.ThreadPoolExecutor$Worker.run() @bci=5, line=615 (Interpreted frame)
- java.lang.Thread.run() @bci=11, line=745 (Interpreted frame)
Here is how it looks in Zabbix CPU utilization graph (case without JMS stuck):
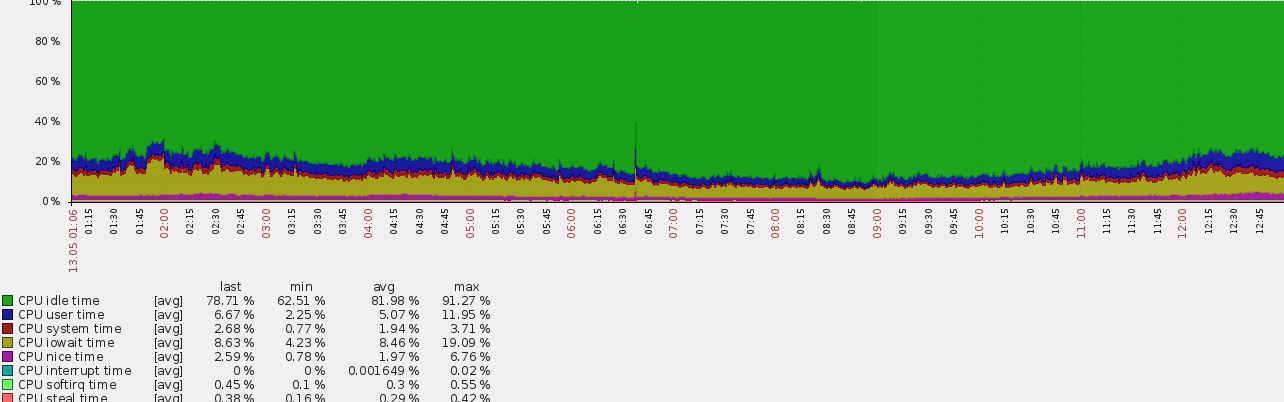
As far as I understand, this is journal sync or something like that. Is it possible to do something with that?