This content has been marked as final.
Show 7 replies
-
1. Re: Memory leak with org.infinispan.remoting.transport.jgroups.CustomRequestCorrelator?
rvansa Jun 16, 2016 8:08 AM (in response to tomas11)
No, there's no memoryLeaks="disabled" config option in JGroups What version of JGroups do you use? And are there any exceptions thrown during the execution? What's your replication timeout setting? Are those instances of Requests in the map Unicast or GroupRequests? Can you check if these already have any response (and just haven't been removed) or if they still expect it (and therefore are kept around)?
-
2. Re: Memory leak with org.infinispan.remoting.transport.jgroups.CustomRequestCorrelator?
tomas11 Jun 16, 2016 9:08 AM (in response to rvansa)
Hi Radim
It would be really nice to have memoryLeaks="disabled" config option
Here are my answers to your questions. Would be glad if you look at it and find some clue.
What version of JGroups do you use?
We are using infinispan-embedded-8.2.1.Final which I think uses jgroups-3.6 version
And are there any exceptions thrown during the execution?
org.infinispan.util.concurrent.TimeoutException: Replication timeout
which is followed by
org.apache.camel.RuntimeCamelException: java.lang.OutOfMemoryError: Java heap space
What's your replication timeout setting?
This is our cache setting for distributed and replicated cache. Our hw is rather slow in CPU power so maybe there makes a sense to extend default timeouts?
<distributed-cache name="cache" owners="5" mode="ASYNC" deadlock-detection-spin="1000">
<store-as-binary keys="false" values="false"/>
<state-transfer enabled="true" timeout="2000000" />
</distributed-cache>
<replicated-cache name="cache" mode="ASYNC" deadlock-detection-spin="1000">
<store-as-binary keys="false" values="false"/>
<transaction mode="NON_XA" locking="PESSIMISTIC" transaction-manager-lookup="org.infinispan.transaction.lookup.GenericTransactionManagerLookup" stop-timeout="30000" />
<locking isolation="READ_COMMITTED" acquire-timeout="60000" striping="false" concurrency-level="1000"/>
<state-transfer enabled="true" timeout="2000000" />
</replicated-cache>
Are those instances of Requests in the map Unicast or GroupRequests?
UnicastRequests
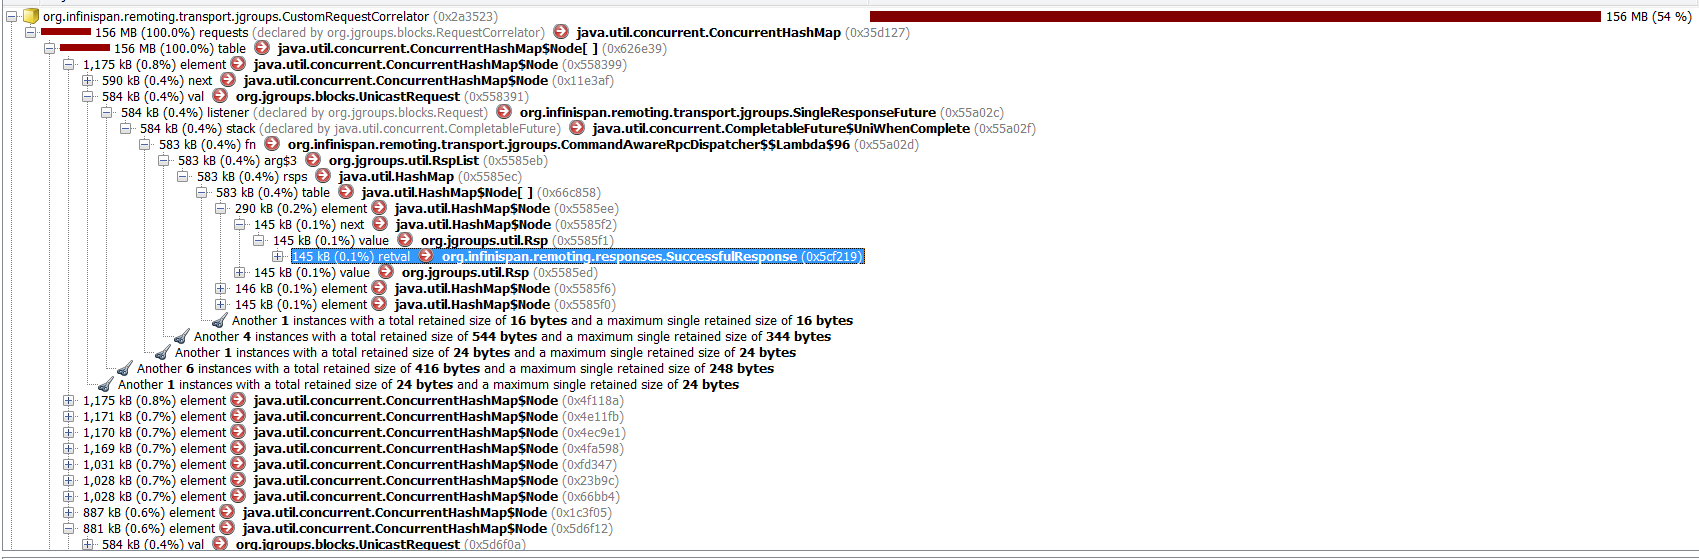
Can you check if these already have any response (and just haven't been removed) or if they still expect it (and therefore are kept around)?
It looks like they already have SuccessfulResponse. I attach also picture from profiler.

It seems that it is rather firs case than (they just have not been removed).
What could be reason for that?
Thanks
-
3. Re: Memory leak with org.infinispan.remoting.transport.jgroups.CustomRequestCorrelator?
rvansa Jun 16, 2016 9:53 AM (in response to tomas11)
Seems like the requests in the map are sorted by size; you show the first one, but I am more interested in the majority (first few are > 1kB, others are smaller - do these hold the response as well?).
Your configuration looks fine, but you encounter replication timeouts - how many do you get (handful, or thousands)?
-
4. Re: Memory leak with org.infinispan.remoting.transport.jgroups.CustomRequestCorrelator?
tomas11 Jun 17, 2016 3:11 AM (in response to rvansa)
Hi Radim
There are actually 813 objects. And it seems that all have received Successful response. I do not know what kind of information would you be interested in to know to see where problem lies. Since heap dump is quite big it does not make sense to provide it here.
Regarding replication timeouts. We get them time to time. Hard to predict. I've mentioned that also in here org.infinispan.util.concurrent.TimeoutException: Replication timeout but do not get some 100% satisfied answer what should do to prevent it. Since our hw environment is rather slow on CPU and we can get many put operations to caches (high load). Can this be a cause that replication in cluster to other nodes is not fast enough?
My feeling is that when there are lot of cluster wide operations (like cache.values()) it can influence that state? Or is this a false feeling?
-
5. Re: Memory leak with org.infinispan.remoting.transport.jgroups.CustomRequestCorrelator?
rvansa Jun 17, 2016 3:42 AM (in response to tomas11)
Looking again on the heap dump screenshot I see that I've mixed it a bit in the hurry, mistaken kBs for bytes... If you have 813 responses 145kB in size, the numbers make sense.
In my experience, replication timeouts are caused either by GC, some I/O getting stuck (if there's a lot of logging info, it can slow down everything), or low JGroups' UFC/MFC thresholds. But if it happens just from time to time, it's fine; distributed application has to expect those.
However, regarding the leak, I am not sure how to proceed; normally I would ask for trace logs, but this part of code does not have much logs. And given that this is something everyone uses (and hasn't changed for a while), it surprises me that there could an unnoticed bug. Any chance you could reproduce that in a test?
-
6. Re: Memory leak with org.infinispan.remoting.transport.jgroups.CustomRequestCorrelator?
rvansa Jun 20, 2016 5:30 AM (in response to rvansa)
Eh, just noticed that this code was changed in JGroups 3.6.7 which is used by Infinispan 8.2.1 [JGRP-2001] RequestCorrelator: request-ID is sent in request and header - JBoss Issue Tracker but later reverted [JGRP-2013] RequestCorrelator: done() is slow - JBoss Issue Tracker Could you try to downgrade to JGroups 3.6.6 and check if the leak persists? I would recommend upgrading to 3.6.8 but there are some known binary-compatibility problems.
-
7. Re: Memory leak with org.infinispan.remoting.transport.jgroups.CustomRequestCorrelator?
nadirx Jun 20, 2016 5:31 AM (in response to rvansa)
The bin-compatibility should be resolved in 3.6.9.Final, but we probably need to wait for a further release because of other issues.