9 Replies Latest reply on Sep 29, 2016 12:54 PM by loleary

    server is taking a long time to complete this request

    karthikraj

      Hello All,


      We have been using Version JON 3.3.0.GA Update 05 in one of our environments with single agent monitoring our EAP which has 20 nodes.

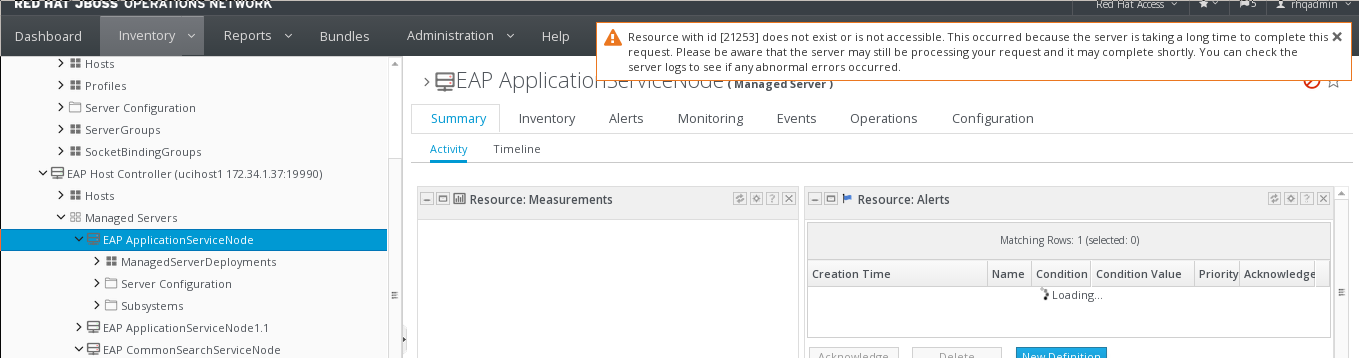
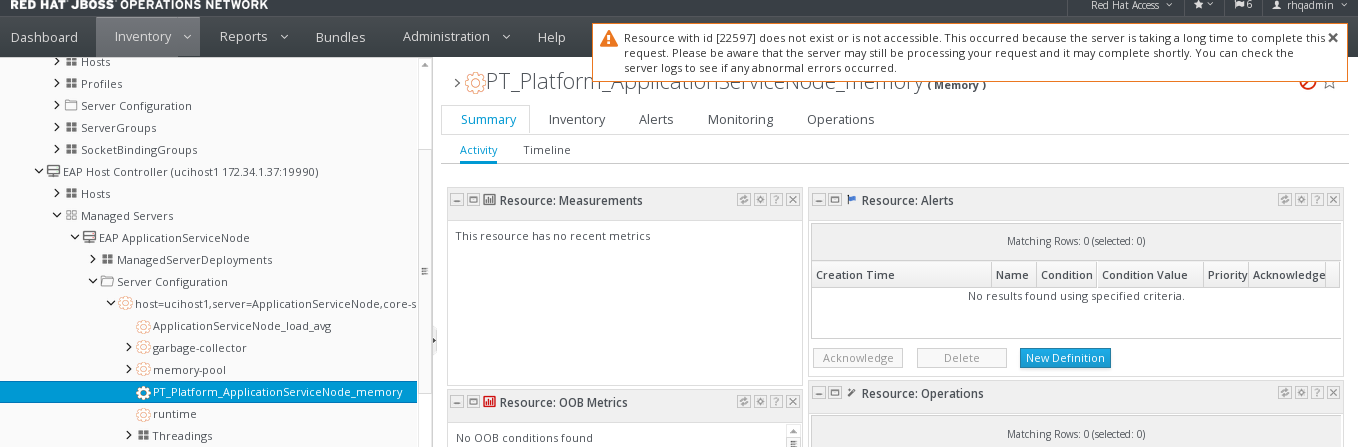
      Whenever I am clicking on resources in GUI ,we have been getting error as


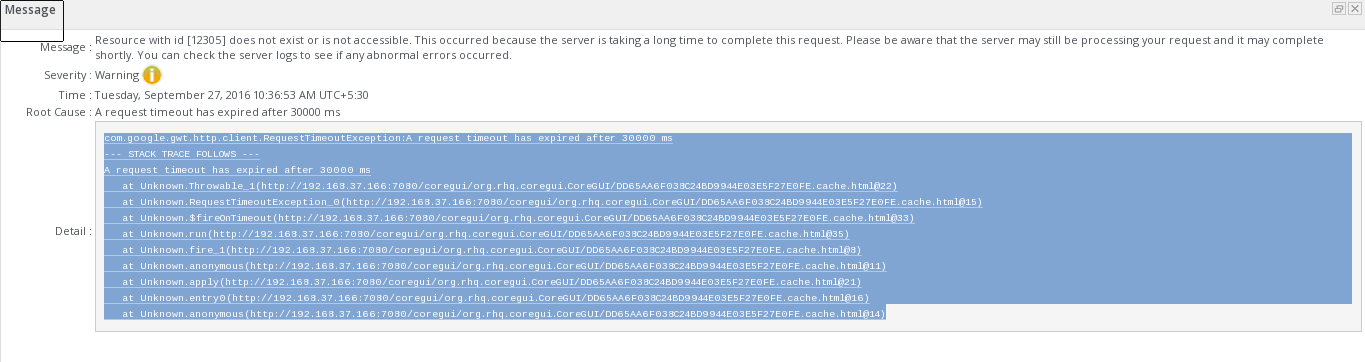
      "Resource with id [22597] does not exist or is not accessible. This occurred because the server is taking a long time to complete this request. Please be aware that the server may still be processing your request and it may complete shortly. You can check the server logs to see if any abnormal errors occurred. "


      Root Cause :

      A request timeout has expired after 30000 ms

      Detail :

      com.google.gwt.http.client.RequestTimeoutException:A request timeout has expired after 30000 ms

      --- STACK TRACE FOLLOWS ---

      A request timeout has expired after 30000 ms

         at Unknown.Throwable_1(http://192.168.37.166:7080/coregui/org.rhq.coregui.CoreGUI/DD65AA6F038C24BD9944E03E5F27E0FE.cache.html@22)

         at Unknown.RequestTimeoutException_0(http://192.168.37.166:7080/coregui/org.rhq.coregui.CoreGUI/DD65AA6F038C24BD9944E03E5F27E0FE.cache.html@15)

         at Unknown.$fireOnTimeout(http://192.168.37.166:7080/coregui/org.rhq.coregui.CoreGUI/DD65AA6F038C24BD9944E03E5F27E0FE.cache.html@33)

         at Unknown.run(http://192.168.37.166:7080/coregui/org.rhq.coregui.CoreGUI/DD65AA6F038C24BD9944E03E5F27E0FE.cache.html@35)

         at Unknown.fire_1(http://192.168.37.166:7080/coregui/org.rhq.coregui.CoreGUI/DD65AA6F038C24BD9944E03E5F27E0FE.cache.html@8)

         at Unknown.anonymous(http://192.168.37.166:7080/coregui/org.rhq.coregui.CoreGUI/DD65AA6F038C24BD9944E03E5F27E0FE.cache.html@11)

         at Unknown.apply(http://192.168.37.166:7080/coregui/org.rhq.coregui.CoreGUI/DD65AA6F038C24BD9944E03E5F27E0FE.cache.html@21)

         at Unknown.entry0(http://192.168.37.166:7080/coregui/org.rhq.coregui.CoreGUI/DD65AA6F038C24BD9944E03E5F27E0FE.cache.html@16)

         at Unknown.anonymous(http://192.168.37.166:7080/coregui/org.rhq.coregui.CoreGUI/DD65AA6F038C24BD9944E03E5F27E0FE.cache.html@14)


      *Server load is observed to be very normal ,cpu utilisation is found to be less than 10% always,no peak io wait

      *Changed the server logging message from debug to INFO and increased size heap of Server from 2gb to 3gb

      *Reckoned it may be due to read latency in storage server hence Increased the heap size of cassandra from 2gb to 3gb(storage server in same machine)


      But always getting the same error as mentioned above when i am clicking on any resources.

      Please help on this.Is there any chance to change the time out value??or Suggest me the any solutions for getting rid off the error

      Find the attachments for reference

        • 1. Re: server is taking a long time to complete this request
          loleary

          Most likely cause is a slow database response from the database backing your JBoss ON system. Try going to one of the other tabs such as Monitoring > Metrics and refreshing the page from there to see if the same notice occurs.


          If going to other tabs words, then you can try narrowing the slowness down to a specific area or set of data. For example, if the metrics page can be displayed without the 30 second timeout notice, try the Alerts > History page.


          For you get the 30 second timeout on all tabs, then it is the resource itself that is failing to load. However, I highly doubt that is the case considering that the page does render and appears to have the resource detail data loaded at the top.


          Hope that helps.

          • 2. Re: server is taking a long time to complete this request
            karthikraj

            Hello Larry,


            We have two more agents connected with the same server however I am not getting these kind of errors for those agents,observing errors for the particular agent.And tried with ur suggestion as mentioned,I am getting same error to all the tabs (30 seconds timeout) for the particular agent.


            Hence the Problem is not with database latency since not getting error for other two agents.??
            You have mentioned as "For you get the 30 second timeout on all tabs, then it is the resource itself that is failing to load"
            What is meant by resource itself is failing to load (problem with the agent?) can u please give insight on that??


            Regards
            Karthikraj

            • 3. Re: server is taking a long time to complete this request
              loleary

              Correct. If you are seeing the error on each page of the resource on one agent and are not seeing it on similar resources on other agents, then it may not be related to database latency.


              When you access one of the resource's pages, requests are made to the database to find out what data needs to be displayed. If the page contains metric specific values or aggregates, a request is also made to the storage node (Cassandra).


              Finally, the resource's availability is checked every 15 seconds when any of the resource page's are viewed. This is so that the availability icon in the top right can be updated and reflect a closer to real-time availability of the resource. This availability check will result in a request going to the agent to inquire to the resource's live availability. Perhaps it is this operation that is taking too long?


              Does all the expected data appear on the page when you navigate to the resource's tab/sub-tabs? If so, you may want to look into performance of the individual agents that these resources are managed by. For example, if agent load is high or memory is low, it can cause this live availability check to take several seconds. In addition to the server processing agent data from this agent and others, it could result in the availability report not getting processed for more the 30 seconds and therefore the timeout notice.


              I would start with reviewing the agent log for any warnings or errors related to timeouts or any log message that include the text PERF. Also, your browser's debug/console log may provide more details to the error. I would expect to see a more meaningful stack on the client-side.


              Hope that helps,

              --

              Larry O'Leary

              • 4. Re: server is taking a long time to complete this request
                karthikraj

                Larry,


                **Does all the expected data appear on the page when you navigate to the resource's tab/sub-tabs?

                         Yes,could get the details


                **I would start with reviewing the agent log for any warnings or errors related to timeouts or any log message that include the text PERF.

                         Getting time out error only when i am stopping the agent, otherwise no timeout errors were recorded


                2016-09-26 15:22:23,650 WARN  [WorkerThread#0[172.34.1.85:45117]] (command.impl.remotepojo.server.RemotePojoInvocationCommandService)- {RemotePojoInvocationCommandService.remote-pojo-execute-failure}Failed to execute a remote pojo invocation. Cause: java.lang.NoSuchMethodException: There is no remote POJO that can service the method invocation request. Command: Command: type=[remotepojo]; cmd-in-response=[false]; config=[{rhq.security-token=U1Wam2jZtvpPKKdrxWXC08k5BHn7ChurHpbxhoYfWOka2Kh+c1D0lj+6PzclIfcFPUg=, rhq.timeout=5000, rhq.send-throttle=true}]; params=[{invocation=NameBasedInvocation[ping], targetInterfaceName=org.rhq.core.clientapi.agent.ping.PingAgentService}]

                2016-09-26 15:22:25,745 INFO  [Thread-25] (org.rhq.core.pc.PluginContainer)- All shut down background threads have terminated (3 seconds elapsed).


                **it could result in the availability report not getting processed for more the 30 seconds and therefore the timeout notice.

                Larry , is there options change the settings from 30 secs to some value


                • 5. Re: server is taking a long time to complete this request
                  loleary

                  karthik raj wrote:


                  **it could result in the availability report not getting processed for more the 30 seconds and therefore the timeout notice.

                  Larry , is there options change the settings from 30 secs to some value

                  The UI operation timeout can not be changed.


                  Check your browser's debug/console log to see if there is a more meaningful stack trace associated with the error. Once you can confirm that it is the availability check, you will want o focus your attention on agent or network performance between the JBoss ON server and this agent.

                  --

                  Larry O'Leary

                  • 6. Re: server is taking a long time to complete this request
                    karthikraj
                    • 7. Re: server is taking a long time to complete this request
                      loleary

                      I was referring to the log/stack displayed in your browser's debug console. For example, if using Chrome, the debug log can be seen on the Console tab of the Developer Tools page. Internet Explorer also has the debug logs available on a similar page and refers to it as the F12 developer tools. Firefox refers to it as the Web Console.


                      Hope that helps,

                      --

                      Larry O'Leary

                      • 8. Re: server is taking a long time to complete this request
                        karthikraj

                        Thanks for your beneficial replies,

                        As per your advice I referred logs in my browser debug console,


                        *While clicking on particular resource , rpc  methods are getting invocated initially to display the output.

                        *Once page got displayed ,resource "availability rpc method" was getting invocated after 15 seconds again the same rpc was invocated and it happened regularly in all the agents (no errors)


                        Suspect agent: While observing the debug console in supspected agent,

                        once resource availability rpc method was invocated ,after 30 seconds getting the time out message in console

                        After getting the time out message ,15 seconds later, availability rpc method is getting invocated again and getting time out message after 30 seconds ,this was happening regularly.


                        So,server is not able to process the availabilty of agent right??

                        hence the problem with the agent is clear??

                        • 9. Re: server is taking a long time to complete this request
                          loleary

                          This tells us a couple of things.


                          First, the notice can be ignored as it deals only with the live availability request that the UI performs every 15 seconds while viewing a resource. This warning does not interfere with the UI and operation of monitoring or management of the resource.


                          Second, it tells us that either the agent is taking longer then 30 seconds to process the request or that the target managed resource is taking longer then 30 seconds to respond.


                          I would also consider the timeout notice as a user experience bug. As this condition could happen at any time, due to temporary agent load or restarting of other managed servers/services, I would expect that this live availability check not generate any noise that would interfere with the operation of the UI. That perhaps a better response to this would be to simply suppress additional live availability checks and showing the processing animation for the availability icon in the top right of the resource view until the request either completes or it returns some error condition that would result in a DOWN, UP, or UNKNOWN status.


                          As for your environment, I would suggest you investigate possible performance or load issues on these agent machines to see if perhaps this agent is falling behind on its monitoring duties. Or perhaps these resources are just taking too long to respond to the availability checks?


                          As for the user experience bug I have captured product bug report  Bug 1380471. Please note that JBoss ON is currently in its maintenance phase of its product support life-cycle meaning that only security or critical bugs get considered for inclusion in the maintenance releases.

                          1 of 1 people found this helpful