Hello,
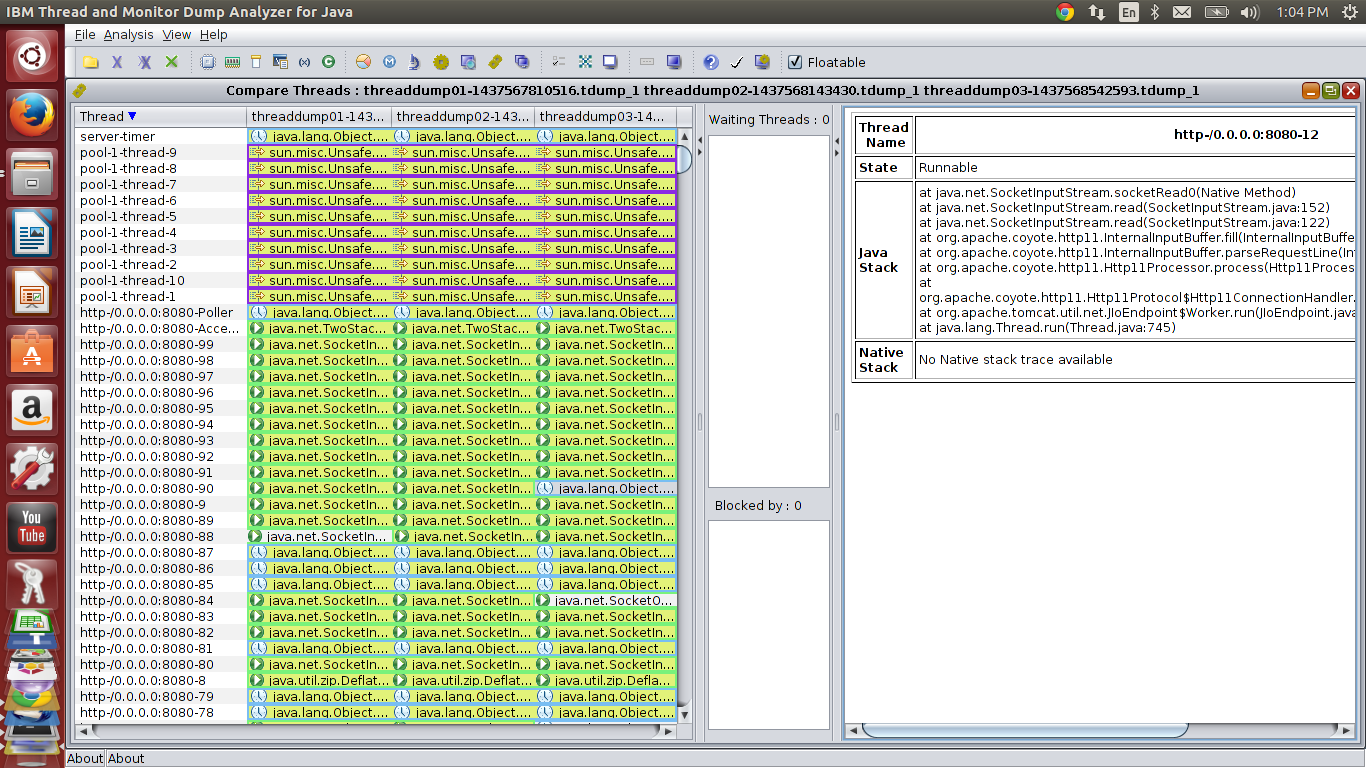
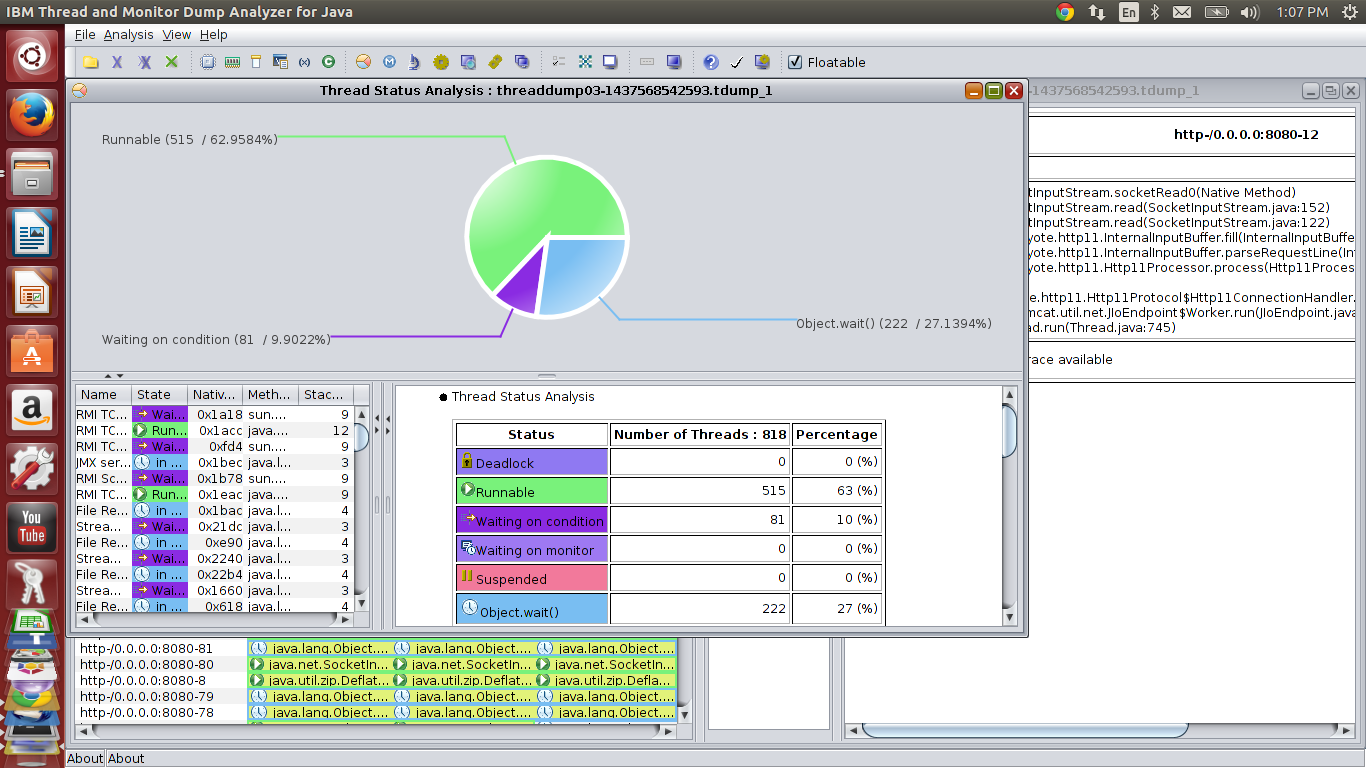
We have jboss eap 6.2 implemented at one of out client sites. Generally it happens that after 2-3 Days the Utilization starts shooting up and uktimately reaches 100%. Hence a restart is required. customer has jboss support but before that i wanted to analyse the thread dumps myself. When i did this i see so many http threads (around 814) with the below stack information:
at java.net.SocketInputStream.socketRead0(Native Method)
at java.net.SocketInputStream.read(SocketInputStream.java:152)
at java.net.SocketInputStream.read(SocketInputStream.java:122)
at org.apache.coyote.http11.InternalInputBuffer.fill(InternalInputBuffer.java:721)
at org.apache.coyote.http11.InternalInputBuffer.parseRequestLine(InternalInputBuffer.java:359)
at org.apache.coyote.http11.Http11Processor.process(Http11Processor.java:821)
at org.apache.coyote.http11.Http11Protocol$Http11ConnectionHandler.process(Http11Protocol.java:653)
at org.apache.tomcat.util.net.JIoEndpoint$Worker.run(JIoEndpoint.java:920)
at java.lang.Thread.run(Thread.java:745)
Im also giving a a screenshot from ibm thread analyser.
Hello Mitesh,
We are experiencing similar issue with jboss and slowness usually end of day. Can you please share how this issue was addressed.
Thanks