This content has been marked as final.
Show 1 reply
-
1. Re: Changing the limit of graph in JON
pathduck Nov 15, 2016 6:11 AM (in response to karthikraj)
Hi,
I don't think it's possible to increase the number of graphs drawn, and honestly, I think it would look like a mess. IMO anything with over 20-30 graphs in a single chart would be too hard to read. Also there would be a hard limit to the number of colours being used anyway.
For monitoring of a large number of servers, looking at graphs is kind of pointless anyway, you need to create alerts to let you know when something is out of the ordinary. But I agree graphs are a good tool to visualize data over time.
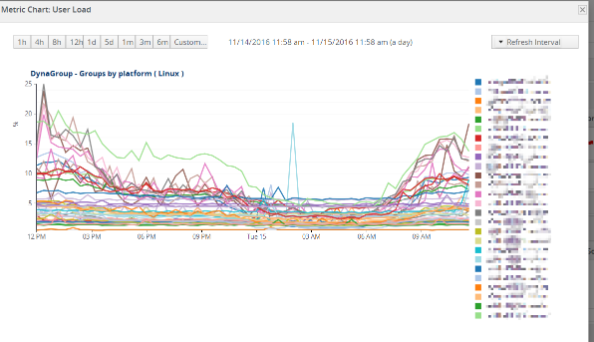
Example showing User Load for Linux servers, these are all different applications, so usage is varied, if you had for instance a lot of servers with the same app doing the same, it might look more consistent:
For visualizing a large number of resources, I recommend you look into something like using the REST interface to get data to put into for instance Grafana and create dashboards there.
I've earlier requested some improvements to the graphing, like being able to turn on/off graphs and better to visualize the resources, but probably nothing will happen now, I doubt any more features will be added to JON or RHQ.
Stian
