Performance issue when using ClusteredLock
Hello,
sorry by advance for my approximate english
I am facing perfomance issue with the clusteredLock API when i stress my application.
My cluster is composed of 2 members.
My application processes resources that are shared by the 2 cluster members, these resources are modified via a rest API and JMS.
I use ClusteredLock for concurrent access management.
I see on a very simple first performance test, during 900 seconds I inject 10 resources to be modified per second.
In total, 6000 resources to be processed in a sequential manner, so without concurrent access for this first test.
Then each resource is accessed in modification by external stakeholders (about 9 changes / seconds).
I expect the processing rate of these resources to be constant at 10 resources per second.
From 3000 resources processed (which represents 3000 ClusteredLock to create) the performances collapse and the application arrives less and less to treat resources:
| Temps écoulé | Nombre de ressources en cours de traitement | Nombre de ressources injectées |
|---|---|---|
| 100s | 10 | 1000 |
| 200s | 10 | 2000 |
| 300s | 15 | 3000 |
| 400s | 15 | 4000 |
| 500s | 17 | 5000 |
| 600s | 90 | 6000 |
| 650s | 500 |
If i run the same test witouht restarting the applciation on the 2 servers, the performance collapse ate the very beginning:
| Temps écoulé | Nombre de ressources en cours de traitement | Nombre de ressources injectées |
|---|---|---|
| 10s | 50 | 100 |
| 20s | 90 | 200 |
| 30s | 112 | 300 |
| 40s | 200 | 400 |
| 50s | 250 | 500 |
| I stopped the test at 1 minute |
If stop and rerun the application, then i run the test the performance are as bad as in the first table.
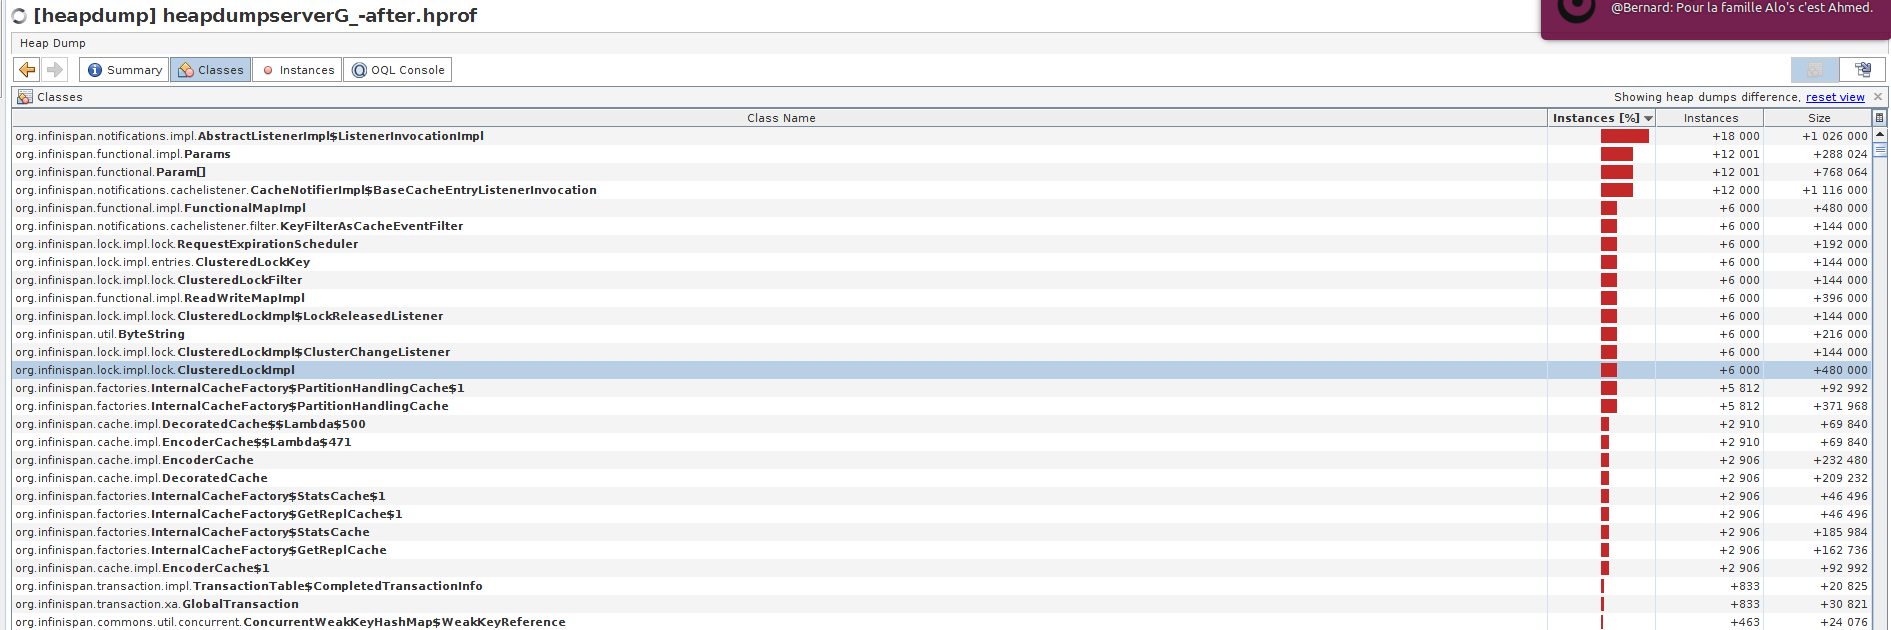
I join the heapdump picture which shows the number of ClusterLockImpl 1 hours after running the stress tests one time, you can see that there are 6000 of ClusterLockImpl remaining instances. Is it normal?
I did the same test without using ClusteredLock (i can because there is no concurrent access for this first test) and the performannces are the expected ones :
| Temps écoulé | Nombre de ressources en cours de traitement | Nombre de ressources injectées |
|---|---|---|
| 100s | 10 | 1000 |
| 200s | 10 | 2000 |
| 300s | 11 | 3000 |
| 400s | 10 | 4000 |
| 500s | 11 | 5000 |
| 600s | 90 | 6000 |
| 650s | 0 |
So I am wondering what i am doing wrong, please find below all my configuration and code.
I hope someoene can help me to understand what is going wrong
thanks by advance.
This how i define the ClusteredLock the firsttime in the cluster:
private void createReservedLock(final String lockName) {
clm.defineLock(lockName); (clm is the ClusteredLockManager instance)
}
This how i acquire the ClusteredLock:
protected ClusteredLock acquireLock(final String lockName) throws DataStoreException {
  ClusteredLock clusteredLock;
  try {
  clusteredLock = clm.get(lockName);

  }  catch (ClusteredLockException e) {
   String msg = String.format("le verrou identifié par %s n'est pas défini dans le ClusteredLockManager.", lockName);
   LOG.error(msg, e);
   throw new DataStoreException(msg);
  }
  try {

  Boolean get = clusteredLock.tryLock(lockAcquistionTimeoutMillisecondes, TimeUnit.MILLISECONDS).get();

  if (get.booleanValue()) {

   LOG.info("Verrou [{}] acquis", lockName);

   return clusteredLock;
} else {
   LOG.error("Verrou [{}] non acquis", lockName);
   }
  }
  catch (ClusteredLockException e) {
   LOG.error("Impossible acquerir le verrou [{}]", lockName, e);
  }
  catch (ExecutionException | InterruptedException e) {
   String msg = String.format("Impossible d'acquerir le verrou %s", lockName);
   LOG.error(msg, e);
   throw new LockAcquisitionException(msg, e);
  }

  String msg = String.format("Echec acquisition du verrou [%s]. ", lockName);
  throw new LockAcquisitionException(msg);
}
This how i unlock it:
protected boolean freeLock(final String lockName, final ClusteredLock lock) {

  LOG.info("Demande de libération du verrou identifié par [{}].", lockName);
  if (lock == null) {
   LOG.warn("Le verrou {} ne peut etre libéré. ClusteredLock invalide: {}", lockName, lock);
   return false;
  }

  int n = FREELOCK_MAX_ATTEMPT;
  do {
   try {
       lock.unlock().get();
        LOG.info("Verrou identifié par [{}] libérée.", lockName);
        return true;
  }
   catch (ClusteredLockException | InterruptedException | ExecutionException e) {
       n--;
        LOG.warn("Le verrou {} ne peut etre libere. Reste {} tentatives", lockName, n, e);
        if (n == 0) {
             LOG.error("Impossible de libérer le verrou {}. Abondon", lockName, e);
            }
       }
  }
  while (n > 0);
  return false;
}
this is how i remove it:
public void removeLock(final String lockKey) {

  LOG.info("Demande de suppression du verrou [{}].", lockKey);
  try {
       final Boolean isLockedRemoved = this.clm.remove(lockKey).get();
       if (!isLockedRemoved) {
             LOG.warn("Le verrou [{}] n'a pas été supprimé.", lockKey);
       }
  }  catch (Exception e) {
  LOG.error("Impossible de libérer le verrou [{}] dans le ClusterLockManager", lockKey, e);
  }
}
I am using infinispan version 9.4.4.Final:
<dependency>
<groupId>org.infinispan</groupId>
<artifactId>infinispan-core</artifactId>
<version>9.4.4.Final</version>
</dependency>
<dependency>
<groupId>org.infinispan</groupId>
<artifactId>infinispan-commons</artifactId>
<version>9.4.4.Final</version>
</dependency>
<dependency>
<groupId>org.infinispan</groupId>
<artifactId>infinispan-clustered-lock</artifactId>
<version>9.4.4.Final</version>
</dependency>
System configuration (same for both server):
• Java 2 Runtime Environment 1.8.0_161
• Linux Kernel 3.10.0-693.17.1.el7.x86_64
• Linux Red Hat Red Hat Enterprise Linux Server release 7.4 (Maipo)
• 8 Go
• 3 vCPU
The cluster configuration below:
<?xml version="1.0" encoding="UTF-8"?>
<infinispan xmlns:xsi="http://www.w3.org/2001/XMLSchema-instance" xsi:schemaLocation="urn:infinispan:config:9.4 http://infinispan.org/schemas/infinispan-config-9.4.xsd" xmlns="urn:infinispan:config:9.4">
<jgroups>
<stack-file name="tcpStack" path="jgroups-tcp.xml"/>
</jgroups>
<cache-container default-cache="mycache" statistics="${enable.stats:false}">
<transport stack="tcpStack" cluster="mycluster"/>
<replicated-cache statistics-available="${enable.stats:false}" name="mycache" statistics="${enable.stats:false}">
<locking concurrency-level="1000" acquire-timeout="5000"/>
<transaction mode="NON_XA" locking="PESSIMISTIC"/>
</replicated-cache>
</cache-container>
</infinispan>
The jgroups configuration file:
<config xmlns:xsi="http://www.w3.org/2001/XMLSchema-instance" xmlns="urn:org:jgroups" xsi:schemaLocation="urn:org:jgroups http://www.jgroups.org/schema/jgroups-4.0.xsd">
<TCP bind_addr="IP_SERVER_A" bind_port="${infinispan.jgroups.tcp.port:7800}" stats="${enable.stats:false}" enable_diagnostics="false" thread_naming_pattern="pl" send_buf_size="640k"
sock_conn_timeout="300" bundler_type="no-bundler" thread_pool.min_threads="${infinispan.jgroups.thread_pool.min_threads:20}" thread_pool.max_threads="${infinispan.jgroups.thread_pool.max_threads:100}"
thread_pool.keep_alive_time="2000"/>
<TCPPING initial_hosts="IP_SERVER_A[7800],IP_SERVER_B[7800]" port_range="0" ergonomics="false" stats="${enable.stats:false}" />
<MERGE3 stats="${enable.stats:false}" min_interval="10000" max_interval="30000"/>
<FD_SOCK stats="${enable.stats:false}"/>
<FD_ALL stats="${enable.stats:false}" timeout="10000" interval="2000" timeout_check_interval="1000"/>
<VERIFY_SUSPECT stats="${enable.stats:false}" timeout="1000"/>
<pbcast.NAKACK2 stats="${enable.stats:false}" use_mcast_xmit="false" xmit_interval="100" xmit_table_num_rows="50" xmit_table_msgs_per_row="1024"
xmit_table_max_compaction_time="30000" resend_last_seqno="true"/>
<UNICAST3 stats="${enable.stats:false}" xmit_interval="100" xmit_table_num_rows="50" xmit_table_msgs_per_row="1024" xmit_table_max_compaction_time="30000"/>
<pbcast.STABLE stats="${enable.stats:false}" stability_delay="500" desired_avg_gossip="5000" max_bytes="1M"/>
<pbcast.GMS stats="${enable.stats:false}" print_local_addr="false" join_timeout="${infinispan.jgroups.join_timeout:5000}"/>
<MFC stats="${enable.stats:false}" max_credits="2m" min_threshold="0.40"/>
<FRAG3 stats="${enable.stats:false}" />
</config>
This is how i started theserver on the 2 members:
jav -server -Xmx4G -Xms4G -Xmn2G -XX:+UseConcMarkSweepGC -XX:+UseParNewGC -XX:+DisableExplicitGC -Dinitialhosts="IP_SERVER_A[7800],IP_SERVER_B[7800]" -Dbindaddr="IP_SERVER_A" -Denable.stats=false -jar engine.jar
jav -server -Xmx4G -Xms4G -Xmn2G -XX:+UseConcMarkSweepGC -XX:+UseParNewGC -XX:+DisableExplicitGC -Dinitialhosts="IP_SERVER_A[7800],IP_SERVER_B[7800]" -Dbindaddr="IP_SERVER_B" -Denable.stats=false -jar engine.jar
-
heapdump_after_metro.png 74.8 KB