This content has been marked as final.
Show 12 replies
-
1. Re: Max values not equal in different graph time spans
john.sanda Jun 21, 2013 4:55 PM (in response to hnwcto)
This sounds like a bug. Would you mind logging an issue at https://bugzilla.redhat.com/enter_bug.cgi?product=RHQ%20Project?
-
2. Re: Max values not equal in different graph time spans
mazz Jun 21, 2013 4:59 PM (in response to hnwcto)
This is described a bit here, in the "Metric Display" section at the bottom here: https://docs.jboss.org/author/display/RHQ/Measurement+Subsystem
In the "old" metric data storage system (I say "old" because in the upcoming 4.8 release coming next week sometime, we will be storing metrics in a different NoSQL storage mechanism), the newest data gets stored in a set of raw database tables. If you zoom into a date range that is narrow enough where all the data is found in the raw tables (1 week), we query the data from those raw tables.
However, due to the amount of raw data RHQ can collect, we end up aggregating older metric data and store that aggregate data in other tables, purging the older raw data as it ages and gets aggregated. This purging of raw data is necessary to limit the amount of storage is required in the backend database.
Now, if you zoom out of the graphs such that the date range requires us to look outside of the raw data tables (wider than a 1 week range), RHQ will query the aggregate data, not the raw data (otherwise, if you ask for the past month, and the raw data only has 1 week, the raw data queries will only show you 1 week of data, the later three weeks will come up empty because there is no data for those older 2 weeks, they were purged and aggregated and moved to the aggregate data tables). That's why the aggregate data tables are queries when you are looking at historical (longer than a week) data range.
So, in this case, you have very new data - you can see the spike when you zoom in because its in the raw tables - but that data hasn't been aggregated yet. So when you zoom out, and you look at the historical, aggregate data (not the new, raw data), you don't see that spike yet. Again, this is because the raw data hasn't been aggregated and moved to the aggregate tables and when you view a date range as long as 30 months, you aren't seeing that new raw data, you are seeing the aggregate data.
Now, the question next to ask is - well, how long does it take for the raw data to get aggregated into the aggregate tables? If you want to learn how the raw data gets aggregated and the schedule that is runs on, see this page:
https://docs.jboss.org/author/display/RHQ/Measurement+Subsystem
Its been a while since I looked at this, but re-reading that and based on how I remember it, the raw data is aggregated and moved to the 1 hour aggregate table every hour. The data then moves along the aggregate tables - moving from the 1h table to the 6h table to the 1 day table - you lose granularity as the data grows older, until the data finally lives in the 1 day table for a year. At that point, the data is purged for good. At the bottom of the page, it shows you what data is queried, based on the date range you are looking at:
- viewing data from 8hr ago - will either select from 1 or 2 of the most recent raw tables
- viewing data from between 12 and 13 days ago - will select from the 1hr table
- viewing data from between 12 and 15 days ago - will select from the 6hr table
- viewing data from between 16 and 30 days ago - will select from the 6hr table
- viewing data from between 16 and 160 days ago - wil select from the 1d table
So, if you are looking at 30 days in the past, you will start to see max and min data points from data that is 6 hours old - anything newer, and you won't see it unless you drill into the date range.
I don't know how the new system with the new metric storage will handle this kind of issue. But this is how all current RHQ releases do it.
-
3. Re: Max values not equal in different graph time spans
mazz Jun 21, 2013 5:02 PM (in response to john.sanda)
This isn't a bug if they are running any of the RHQ releases (not a pre-release of the new 4.8 that hasn't been released officially yet). I assumed this was RHQ 4.7. Matthew, can you confirm what version you are running?
John - perhaps you can explain how the new metric storage system would handle this. I think it will handle this better now, but I actually don't know. Perhaps you can point to a wiki page where the new metric implementation is described (akin to that older wiki page I pointed to that talks about the old metric subsystem).
-
4. Re: Max values not equal in different graph time spans
mazz Jun 21, 2013 5:06 PM (in response to mazz)
John just informed me there was a bug in older versions of RHQ where the max display had a problem: https://bugzilla.redhat.com/show_bug.cgi?id=870561
So again, depending on your version will depend on the answer
-
5. Re: Max values not equal in different graph time spans
hnwcto Jun 21, 2013 5:08 PM (in response to mazz)
RHQ
Version: 4.7.0
Build Number: 51e5261 -
6. Re: Max values not equal in different graph time spans
mazz Jun 21, 2013 5:13 PM (in response to hnwcto)
OK, so that has the bug fix in it (4.7 was released May 2013 and that bug fix went in last November, 2012) and it isn't the 4.8 beta (which is the new stuff), so I believe my long post earlier still stands.
I believe because you are querying for a long historical view (30 days), its taking its data from the 6h table, but your data is so new, it hasn't propogated to that table yet.
I suspect you will see that spike in the 30 day graph when that spike is over 6 hours in age and after the hourly aggregate/purge job runs.
-
7. Re: Max values not equal in different graph time spans
john.sanda Jun 21, 2013 5:22 PM (in response to hnwcto)
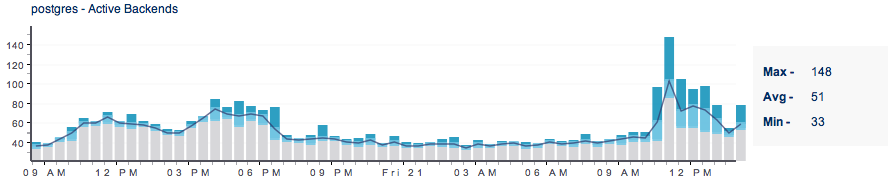
Mazz's explanation is exactly right. The new metrics backend should handle it in the same way. The implementation is obviously different, but the behavior should be the same. Retention periods, which tables to query, etc. will be the same. One implementation detail that is worth noting though is that in the Cassandra-based implementation, we will have only a single raw table whereas in versions prior to RHQ 4.8 we use a set of rotating tables for raw data. Matthew, if you adjust the interval to be from within the past 14 days, I would expect you to see the max of 150. And within six hour of the data initially being stored, the value will get propagated to the 6 hr table at which point you should see the max of 150 when looking at data from the past 30 days.
-
8. Re: Max values not equal in different graph time spans
hnwcto Jun 21, 2013 5:27 PM (in response to john.sanda)
mazz, John,
Great info and thanks for the reply...
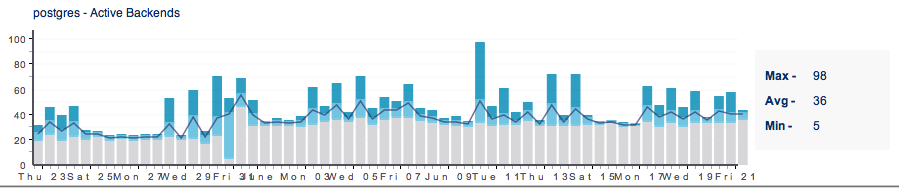
I guess the only "bug" then is that the long-time-span graphs imply they are reporting up to and including real time. If you hover on the last bar, it show's today's date, a time for 5am this morning and a "12 hour" duration, which implies up to now. From what i understand, it really isn't showing me that data is it?
Again, thanks.
-
9. Re: Max values not equal in different graph time spans
john.sanda Jun 22, 2013 9:41 AM (in response to hnwcto)
If you are graphing data from within the past 7 days, then the graphs should be generated using the raw data points; otherwise, they will be generated using aggregated data. Here is the key distinction. With raw data the graphs will include the most recently collected data. With aggregated data, the graphs will include the most recently aggregated data. Let's consider your scenario of looking at data from the past 30 days. Suppose you generate the graph at 6:05 PM, and data during the 12:00 PM to 6:00 PM time slice has just been aggregated into the 6 hr table. If you had raw data that was stored at 5:59 PM, then it will be included in the graph; however, it will not appear as a single point on the graph. It will be part of data point that includes all data aggregated during the 12:00 PM to 6:00 PM time slice. Now instead of generating the graph at 6:05 PM, let's say you generate it at 5:55 PM. The graph would include data no more recent than 12:00 PM.
-
10. Re: Max values not equal in different graph time spans
hnwcto Jun 22, 2013 10:24 AM (in response to john.sanda)
I fully get the mechanics of the raw and aggregated data. My new question is more about what it's implying in the display. This morning (06/22/13) at 10:15 am I view a 30 day graph. As i understand, all this data will be pulled for an aggregate table. Which one is, i think, irrelevant for my point.
When I hover over the last bar in the graph, it says.

Start: 10:12:53 PM
Date: 06/21/13
Duration: 12.0h
To me that implies that bar is drawn from data ranging from last night at 10:12pm up until near-real-time span of 12h to 10:12am.
From what I understand in the explinations, that can't be the case. If it's pulling from a 1 day or 6 hr table, that last bar would have to be described as the last block of time in that that table. Not 12 hours previous to right now, which it always appears to be.
-
11. Re: Max values not equal in different graph time spans
mazz Jun 22, 2013 10:49 AM (in response to hnwcto)
Yeah, I agree we need to make clear what data it is you are looking at. I'm not sure how we do it, but I'm gonna forward this to the guy (Mike T.) that recently re-implemented these graphs (and the graphs are gonna be even better in 4.8) - he worked with some UI design folks when doing it. Maybe we can ask about this problem to see if there is a better way to reflect what's going on.
-
12. Re: Max values not equal in different graph time spans
pilhuhn Jun 22, 2013 12:40 PM (in response to mazz)
I guess with the Cassandra backend it will be easier to grab the metrics from the most specific table for a certain interval.
E.g. take last 360 days.
The most correct would be to take last 7 days from the raw table, then next interval from the 1h table, then 6h then after 30days (?) from the 1d table.
A little less detailed but still better solution would be to take the last 0-6h from the raw table then from 1h aggregate and so on.
Of course when you look at data from a year one can argue that the last 3h don't really matter that much, but as Matthew describes, if you have strange situation and you want to compare with the past, you need to see the current values as well to be able to really see trends etc.
