9 Replies Latest reply on Feb 12, 2014 10:21 AM by rhusar

    JBoss EAP 6.1; standalone mode; pbcast.NAKACK; dropped message from non-member...

    dpasiuk

      Hello, Friends,


      I have recently installed JBoss EAP 6.1, after having been away from JBoss for several years, and I was quite surprised by how much things have changed!


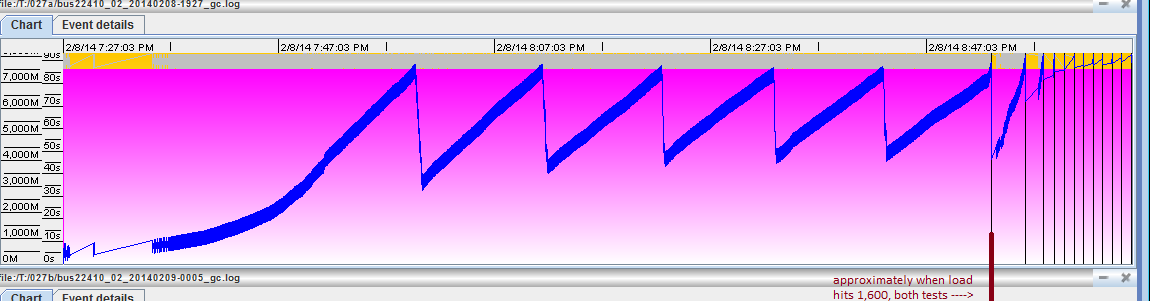
      I'm having trouble resolving a problem during stress tests under high load.  I have configured four standalone server instances (for reasons I won't go into now, domain mode was not an option), distributed over two app servers (so, a 2x2 configuration).  During stress tests, all is well until a certain load level, then all four servers begin to GC out of control, and eventually crash.  Some sample messages from the four servers:


      Node 10_1

      20:57:39,787 WARN  [org.jgroups.protocols.pbcast.NAKACK] (OOB-20,shared=udp) (requester=node11_2/web, local_addr=node10_1/web) message node10_1/web::3006060 not found in retransmission table of node10_1/web:

      [3006048 (3006091) (size=1180, missing=1, highest stability=3004910)]

      20:57:39,837 WARN  [org.jgroups.protocols.pbcast.NAKACK] (OOB-17,shared=udp) (requester=node11_1/web, local_addr=node10_1/web) message node10_1/web::3006060 not found in retransmission table of node10_1/web:

      [3006048 (3006143) (size=1233, missing=0, highest stability=3004910)]

      20:57:39,734 WARN  [org.jgroups.protocols.pbcast.NAKACK] (OOB-18,shared=udp) (requester=node10_2/web, local_addr=node10_1/web) message node10_1/web::3006060 not found in retransmission table of node10_1/web:

      [3006048 (3006079) (size=1168, missing=1, highest stability=3004910)]

      20:59:32,400 WARN  [org.jgroups.protocols.FD] (OOB-16,shared=udp) I was suspected by node11_2/web; ignoring the SUSPECT message and sending back a HEARTBEAT_ACK

      20:59:36,601 WARN  [org.jgroups.protocols.pbcast.GMS] (Incoming-23,shared=udp) node10_1/web: not member of view [node10_2/web|4]; discarding it

      20:59:39,829 WARN  [org.jboss.as.clustering.web.infinispan] (Incoming-25,shared=udp) JBAS010325: Possible concurrency problem: Replicated version id 40 is less than or equal to in-memory version for session essv+YTl68G+8g5pBfel+tqV

      20:59:39,830 WARN  [org.jboss.as.clustering.web.infinispan] (Incoming-25,shared=udp) JBAS010325: Possible concurrency problem: Replicated version id 41 is less than or equal to in-memory version for session essv+YTl68G+8g5pBfel+tqV


      Node 10_2

      20:59:27,904 INFO  [org.jboss.as.clustering] (VERIFY_SUSPECT.TimerThread,web,node10_2/web) JBAS010232: Suspected member: node10_1/web

      20:59:28,021 INFO  [org.jboss.as.clustering] (Incoming-42,shared=udp) JBAS010225: New cluster view for partition web (id: 4, delta: -1, merge: false) : [node10_2/web, node11_1/web, node11_2/web]

      20:59:28,023 INFO  [org.infinispan.remoting.transport.jgroups.JGroupsTransport] (Incoming-42,shared=udp) ISPN000094: Received new cluster view: [node10_2/web|4] [node10_2/web, node11_1/web, node11_2/web]

      20:59:31,705 WARN  [org.jgroups.protocols.pbcast.NAKACK] (Incoming-16,shared=udp) [JGRP00011] node10_2/web: dropped message 3,024,568 from non-member node10_1/web (view=[node10_2/web|4] [node10_2/web, node11_1/web, node11_2/web])


      Node 11_1

      20:59:27,828 INFO  [org.jboss.as.clustering] (VERIFY_SUSPECT.TimerThread,web,node11_1/web) JBAS010232: Suspected member: node10_1/web

      20:59:28,017 INFO  [org.jboss.as.clustering] (Incoming-17,shared=udp) JBAS010226: New cluster view for partition web: 4 (org.jboss.as.clustering.impl.CoreGroupCommunicationService$GroupView@670f68f6 delta: -1, merge: false)

      20:59:28,018 INFO  [org.infinispan.remoting.transport.jgroups.JGroupsTransport] (Incoming-17,shared=udp) ISPN000094: Received new cluster view: [node10_2/web|4] [node10_2/web, node11_1/web, node11_2/web]

      20:59:31,940 WARN  [org.jgroups.protocols.pbcast.NAKACK] (Incoming-13,shared=udp) [JGRP00011] node11_1/web: dropped message 3,024,580 from non-member node10_1/web (view=[node10_2/web|4] [node10_2/web, node11_1/web, node11_2/web])

      20:59:35,896 WARN  [org.infinispan.loaders.file.FileCacheStore] (OOB-45,shared=udp) ISPN000163: FileCacheStore ignored an unexpected file admin in path /scratch/akuchara/AppServers/JBoss/JBoss6.1.0/jboss-eap-6.1/standalone/data/infinispan/web/default-host/dyn. The store path should be dedicated!

      21:01:49,058 WARN  [org.jgroups.protocols.FD] (OOB-82,shared=udp) I was suspected by node10_2/web; ignoring the SUSPECT message and sending back a HEARTBEAT_ACK

      21:01:49,119 WARN  [org.jgroups.protocols.pbcast.NAKACK] (Incoming-7,shared=udp) [JGRP00011] node11_1/web: dropped message 3,026,370 from non-member node10_1/web (view=[node10_2/web|4] [node10_2/web, node11_1/web, node11_2/web]) (received 1,804 identical messages from node10_1/web in the last 137,180 ms)

      21:01:49,055 ERROR [nucleusNamespace.atg.dynamo.servlet.dafpipeline.VirtualContextRootInterceptor] (ajp-/10.152.221.80:8109-43) Could not forward request to context org.apache.catalina.core.ApplicationContextFacade@c6f651d: ClientAbortException:  java.net.SocketException: Broken pipe


      Node 11_2

      20:59:27,938 INFO  [org.jboss.as.clustering] (VERIFY_SUSPECT.TimerThread,web,node11_2/web) JBAS010232: Suspected member: node10_1/web

      20:59:28,044 INFO  [org.jboss.as.clustering] (Incoming-23,shared=udp) JBAS010226: New cluster view for partition web: 4 (org.jboss.as.clustering.impl.CoreGroupCommunicationService$GroupView@22d4c86a delta: -1, merge: false)

      20:59:28,045 INFO  [org.infinispan.remoting.transport.jgroups.JGroupsTransport] (Incoming-23,shared=udp) ISPN000094: Received new cluster view: [node10_2/web|4] [node10_2/web, node11_1/web, node11_2/web]

      20:59:31,685 WARN  [org.jgroups.protocols.pbcast.NAKACK] (Incoming-32,shared=udp) [JGRP00011] node11_2/web: dropped message 3,024,568 from non-member node10_1/web (view=[node10_2/web|4] [node10_2/web, node11_1/web, node11_2/web])

      20:59:35,729 WARN  [org.infinispan.loaders.file.FileCacheStore] (OOB-19,shared=udp) ISPN000163: FileCacheStore ignored an unexpected file admin in path /scratch/akuchara/AppServers/JBoss/JBoss6.1.0/jboss-eap-6.1/standalone/data/infinispan/web/default-host/dyn. The store path should be dedicated!

      20:59:42,533 ERROR [org.apache.catalina.core.ContainerBase.[jboss.web].[default-host].[/crs].[default]] (ajp-/10.152.221.80:8209-255) JBWEB000236: Servlet.service() for servlet default threw exception: java.lang.IllegalStateException: JBAS018058: Session is already expired


      As far as I know I have not specifically enabled session replication of my application, but it appears that some sort of replication is overwhelming my system, and udp messages are not getting delivered to the nodes.  I have a general understanding of what's happening, but I'm not able to find a resolution.  Can anyone provide a few pointers for this problem?


      Thanks

        • 1. Re: JBoss EAP 6.1; standalone mode; pbcast.NAKACK; dropped message from non-member...
          wdfink

          Often the problem is a GC issue from the application, i.e. overload the response gets slower therfore resources are blocking memory and the GC will run crazy.

          After that the nodes get suspected until GC and join back after, this will increase the problem as well.


          I see two start points

          - add org.jgroups debug/trace to see whether the nodes are communicating well during less load

          - analyze the GC behaviour and heap utilization under load to see whether the memory consumption increase linear (memory leak) or is dramaticaly higher with peak load


          If you see a well behaviour for JGroups you need to tune the GC/heap for your requirements

          • 2. Re: JBoss EAP 6.1; standalone mode; pbcast.NAKACK; dropped message from non-member...
            rhusar

            +1


            It really sounds like the heap is complete used up resulting in those errors. Monitor the heap usage during the test.

            • 3. Re: JBoss EAP 6.1; standalone mode; pbcast.NAKACK; dropped message from non-member...
              dpasiuk

              Hi, Wolf-Dieter, and thanks!  See my reply to Radoslav, which is really to both of you.

              • 4. Re: JBoss EAP 6.1; standalone mode; pbcast.NAKACK; dropped message from non-member...
                wdfink

                I did not see a reply to Radoslav

                • 5. Re: JBoss EAP 6.1; standalone mode; pbcast.NAKACK; dropped message from non-member...
                  dpasiuk

                  Wolf-Dieter, Radoslav, thanks for your replies!  I am going to try the org.jgroups debug/trace to see what I can see.  I'll have to Google how to enable that, but if you reply, you might save me a little time!


                  In attempt to keep my original post as brief as possible, I didn't include all my research thus far.  I have been monitoring the memory and GC behavior all along, and I have already ruled out a memory leak.  The recovered memory is pretty linear.


                  I am using the ConcurrentMarkSweep GC algorithm with Oracle JDK 1.7 update 40, and a friend in my office suggested adding a flag which will give the JDK more time to do it's CMS GCs - -XX:CMSInitiatingOccupancyFraction=70, which causes the CMS activity to begin when the heap is 70% used, as opposed to the default 90%.  I'm trying that, too.


                  Dave Pasiuk

                  • 6. Re: JBoss EAP 6.1; standalone mode; pbcast.NAKACK; dropped message from non-member...
                    wdfink

                    The jgroups trace can be activated by add a new catagory "org.jgroups" with TRACE level to the logging subsystem.

                    • 7. Re: JBoss EAP 6.1; standalone mode; pbcast.NAKACK; dropped message from non-member...
                      dpasiuk

                      OK, thanks, I'll try it.  I have to put this aside for a few days to work on another issue, but when I come back I'll try it.  In the meantime, here's a GCViewer graph of the problem, hopefully you can read it:


                      test027a.png

                      Purple=OldGen, around 7.5 GB; Yellow/Gray at top = NewGen, about 0.5 GB; Blue = used heap; Black lines = Full GCs, which are out of control after load hits 1,600 users; time period of graph is about 1.5hr; load ramps up to 1,400 users, runs for 1hr, then 1,600 users.

                      JAVA_OPTS:

                      -D[Standalone] -XX:+UseCompressedOops -Xms8g -Xmx8g -XX:MaxPermSize=256m -XX:ThreadStackSize=128k -Djava.net.preferIPv4Stack=true -XX:+UseConcMarkSweepGC -XX:+CMSClassUnloadingEnabled -XX:+ExplicitGCInvokesConcurrent -Dtomcat.util.buf.StringCache.byte.enabled=true -Dtomcat.util.buf.StringCache.char.enabled=true -Dtomcat.util.buf.StringCache.trainThreshold=5 -Dtomcat.util.buf.StringCache.cacheSize=500 -XX:+PrintCommandLineFlags -XX:+PrintGCTimeStamps -XX:+PrintGCDetails -Xloggc:<path to>gc.log -Dsun.rmi.dgc.client.gcInterval=3600000 -Dsun.rmi.dgc.server.gcInterval=3600000 -Dsun.lang.ClassLoader.allowArraySyntax=true -Djboss.modules.system.pkgs=org.jboss.byteman -Djava.awt.headless=true


                      Any insights are greatly appreciated.


                      Dave Pasiuk

                      • 8. Re: JBoss EAP 6.1; standalone mode; pbcast.NAKACK; dropped message from non-member...
                        wdfink

                        For me it looks likte that the NewGen is a bit too small.

                        The OldGen fall back to a ground level of 4GB, so it look like some Object survive too often, are moved into the OldGen and died here.


                        Best is that all fluent (temporary needed) Objects are hold in the NewGen and die here, this will not as expensive as for OldGen.

                        In case you increase the load there is more memory and CPU power needed to handle it. In this case the duration is longer, and you need more and longer memory.

                        So you become in a situation where all Objects move fast into the OldGen, the JVM run more GC and need CPU.


                        You might check whether increase the memory of New or OldGen will help, if this end in the same situation you should consider more cluster nodes or more CPU power.

                        • 9. Re: JBoss EAP 6.1; standalone mode; pbcast.NAKACK; dropped message from non-member...
                          rhusar

                          Just to understand the benchmark:

                          • The load is increasing in the test and memory is constant, so there will be more GC needed and will eventually run out of memory. So the problem I suppose is that it happens to quickly?
                          • Did you dump the heap when it crashed? To make sure there is not a memory leak, check what was in the memory, which objects were taking the space and if any of those objects were unnecessary.
                          • What is the cluster size, is is 2 on 2 server, so 4 nodes total? Did you try switcing replicated mode to distributed more? (so instead of 4 owners, there will be 2 (by default, or reconfigure with owners="3" or so)).
                          • Did you try the same work load on standalone, non-clustered node? When did that crash?

                          I guess, these are basic questions before we can start digging into details.