This content has been marked as final.
Show 2 replies
-
1. Re: How are Group Metrics calculated for sparklines/bar graphs?
mithomps Jan 15, 2015 5:25 PM (in response to pathduck)
Hi Stian,
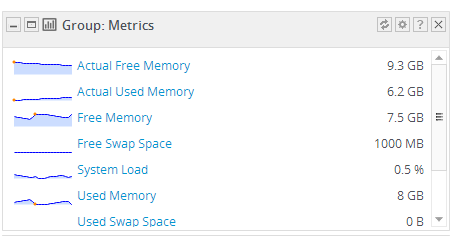
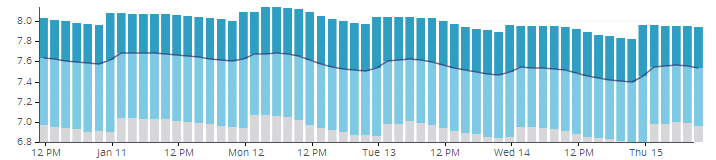
You are correct in assuming that the sparklines for a group are an average over the resources in the group (over 8 hr period) and the text value being the 'last' value in collection interval.
Probably a better representation is multi-line graph showing all resources individually. However, since there is already a couple paths to multi-line charts now and our focus is on RHQ.next() it will probably remain in its current form.
-- Mike
-
2. Re: How are Group Metrics calculated for sparklines/bar graphs?
pathduck Jan 16, 2015 4:17 AM (in response to mithomps)
Thanks Mike - I kind of figured they were averages, just wanted to make sure
I think bars are fine as long as there are averages - we already have line graphs available and I rarely click into the "see more" section anyway.
cheers,
Stian