Request for release version of Wildfly with fix for issue LOGMGR-153
Hello Team,
We see an outOfMemory exception on testbed running Wildfly 2.0.0 every few days. Java heap space runs out of memory and Wildfly sends command to shutdown server or application process. This causes the testbed UI to become un reachable every few days.
Below are some log snippets:
2020-01-19T23:08:35.517-0800: 101678.723: [GC pause (G1 Evacuation Pause) (young) 14G->14G(15G), 0.0150030 secs]
2020-01-19T23:08:35.533-0800: 101678.738: [GC concurrent-mark-abort]
2020-01-19T23:08:35.543-0800: 101678.748: [Full GC (Allocation Failure) 14G->14G(15G), 36.4233708 secs]
2020-01-19T23:09:11.967-0800: 101715.172: [Full GC (Allocation Failure) 14G->14G(15G), 35.7238121 secs]
2020-01-19T23:09:47.701-0800: 101750.906: [GC pause (G1 Evacuation Pause) (young) 14G->14G(15G), 0.0176861 secs]
2020-01-19T23:09:47.729-0800: 101750.934: [GC pause (G1 Evacuation Pause) (young) (initial-mark) 14G->14G(15G), 0.0173387 secs]
2020-01-19T23:09:47.747-0800: 101750.952: [GC concurrent-root-region-scan-start]
2020-01-19T23:09:47.747-0800: 101750.952: [GC concurrent-root-region-scan-end, 0.0001244 secs]
2020-01-19T23:09:47.747-0800: 101750.952: [GC concurrent-mark-start]
2020-01-19T23:09:47.758-0800: 101750.963: [GC pause (G1 Evacuation Pause) (young) 14G->14G(15G), 0.0154238 secs]
2020-01-19T23:09:47.785-0800: 101750.990: [GC pause (G1 Evacuation Pause) (young) 14G->14G(15G), 0.0144528 secs]
2020-01-19T23:09:47.810-0800: 101751.015: [Full GC (Allocation Failure) 14G->14G(15G), 34.9901929 secs]
2020-01-19T23:10:22.800-0800: 101786.005: [Full GC (Allocation Failure) 14G->14G(15G), 35.2063560 secs]
2020-01-19T23:10:58.017-0800: 101821.222: [GC pause (G1 Evacuation Pause) (young) 14G->14G(15G), 0.0174817 secs]
2020-01-19T23:10:58.035-0800: 101821.240: [GC concurrent-mark-abort]
2020-01-19T23:10:58.045-0800: 101821.250: [Full GC (Allocation Failure) 14G->14G(15G), 34.6728960 secs]
2020-01-19T23:11:32.718-0800: 101855.923: [Full GC (Allocation Failure) 14G->14G(15G), 36.3265586 secs]
20-Jan-2020 01:09:51,835 PST INFO [] [server] (Thread-2) || WFLYSRV0220: Server shutdown has been requested via an OS signal
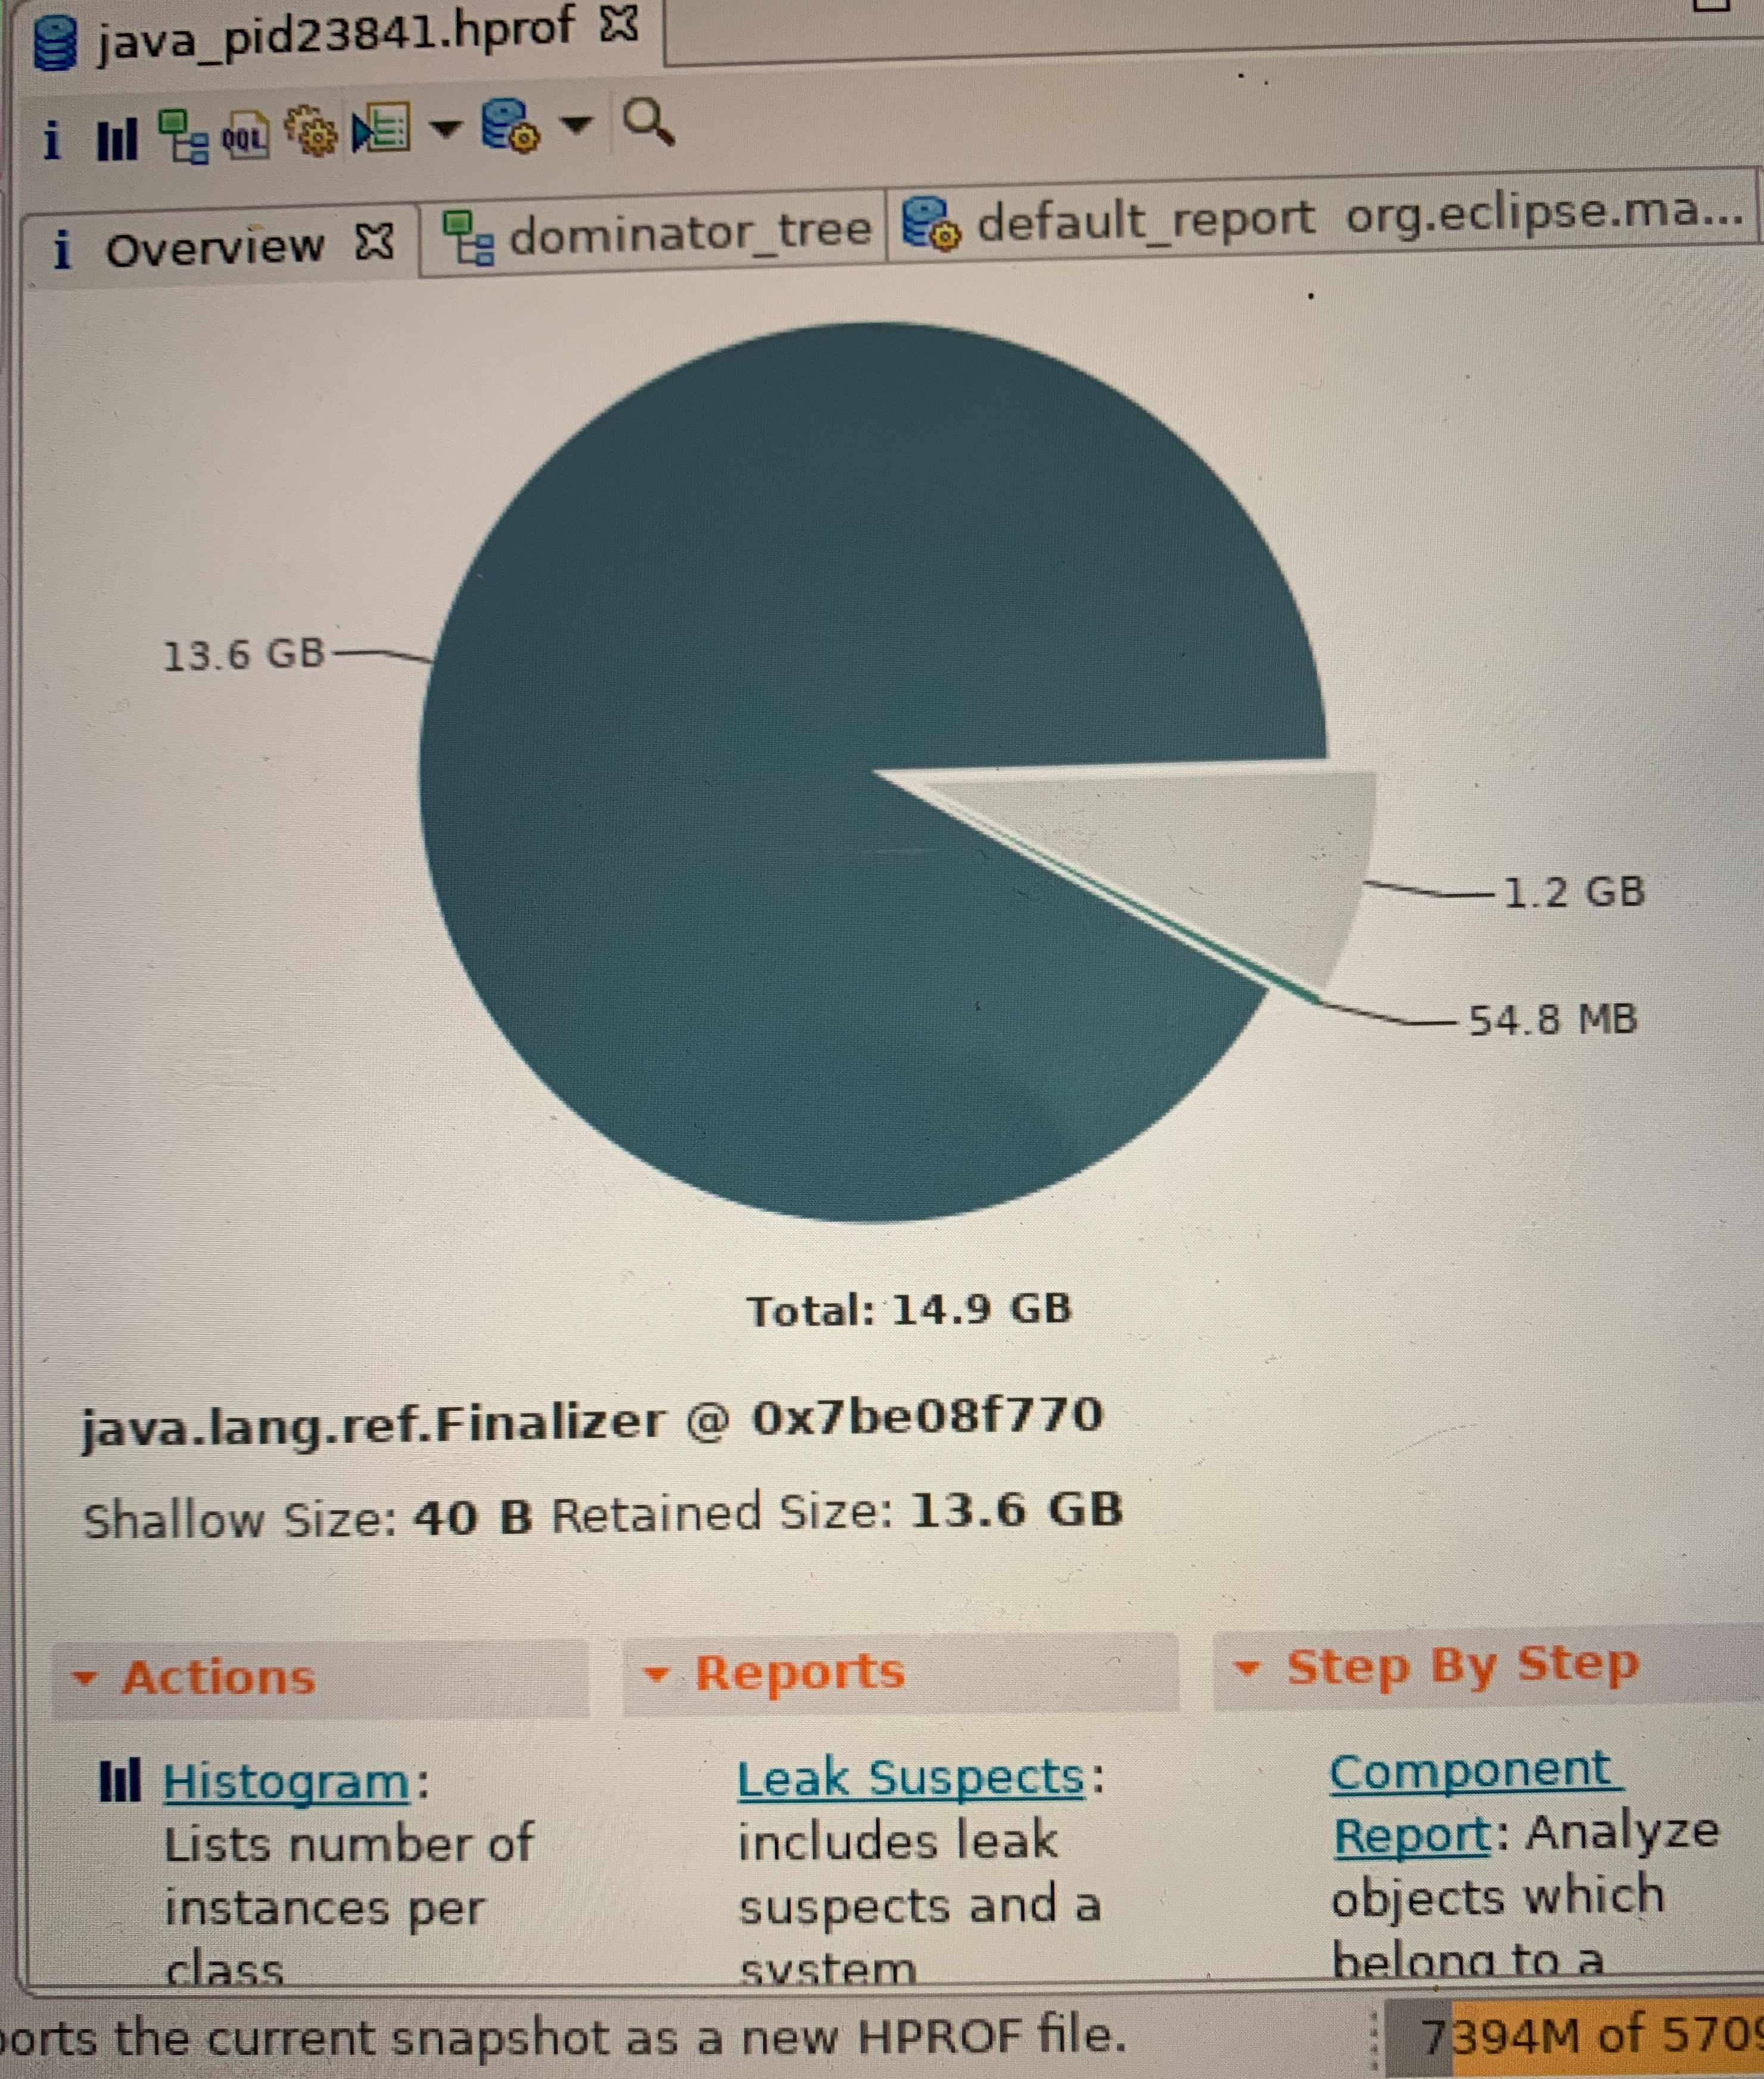
Upon analyzing the heapdump we found that out of 14.9GB of heap space, 13.8GB was being retained by jboss.LogManager.Logger. Upon looking into the code it seems that jboss logger is creating logger-node for every child logger. For every child logger-node, a new copy-on-write map object is created for storing the log event entries. To keep track of clean-up, a reference counter is being used that gets decremented when the finalize() function in jboss.LogManager.Logger gets called, which is called by GC non-deterministically.
We see that this issue has been addressed by:
[LOGMGR-153] Remove finalization from Logger - Red Hat Issue Tracker
Please find attached the screenshot of heapdump analysis.
Can you please help us out with the version of Wildfly that has the fix?
-
IMG_2951.jpg 2.6 MB
-
IMG_2948.jpg 2.8 MB