Flot, the underlying library for rich:chart, is written in JavaScript. As such it is not practical to delegate all customization to the RichFaces components, although we might add more customization in there as well. In RichFaces 4.5.1 we are adding a new attribute and facet to rich:chart - hooks. These allow to customize the chart by hooking into the processing phases on the client-side (as described in the documentation). This is similar to rich:editor customization through the "config" facet. Let's see some examples:
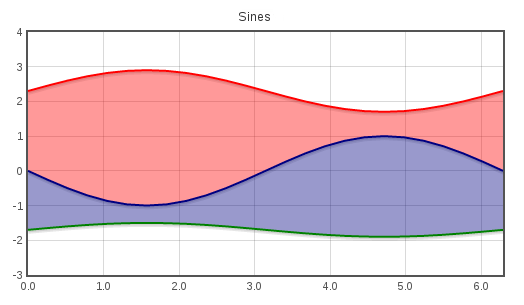
Plugins - fillBetween
The fillBetween plugin allows you to fill areas between line charts (as opposed to the default that fills the area between the chart and the baseline).
Enabling the default fill can be done like this:
<rich:chart title="Sines" id="chart1">
    <f:facet name="hooks">
        {
            processRawData: [function(plot,series) {
                    series.lines.fill = true;
            }]
        }
    </f:facet>
    <rich:chartSeries type="line" color="red">
        <a4j:repeat value="#{sineBean.sinX}" var="sin" rowKeyVar="rk">
            <rich:chartPoint x="#{sin.x}" y="#{sin.y * 0.6 + 2.3}" />
        </a4j:repeat>
    </rich:chartSeries>
    <rich:chartSeries type="line" color="navy">
        <a4j:repeat value="#{sineBean.sinX}" var="sin" rowKeyVar="rk">
            <rich:chartPoint x="#{sin.x}" y="#{-sin.y}" />
        </a4j:repeat>
    </rich:chartSeries>
    <rich:chartSeries type="line" color="green">
        <a4j:repeat value="#{sineBean.sinX}" var="sin" rowKeyVar="rk">
            <rich:chartPoint x="#{sin.x}" y="#{sin.y * 0.2 - 1.7}" />
        </a4j:repeat>
    </rich:chartSeries>
    <rich:chartLegend />
</rich:chart>
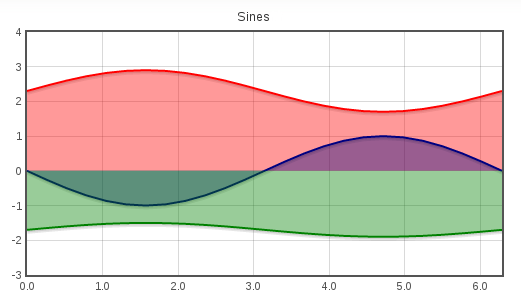
And now with fillBetween; first, we need to insert the plugin. Plugins register themselves to the main library automatically so linking the file is all you need:
<h:outputScript library="flot" name="jquery.flot.fillbetween.js" target="head" />
Then, we need to modify the hooks:
<f:facet name="hooks">
(function() {
var id = 0;
return {
processRawData: [function(plot,series) {
series.id = "id" + id;
if (id < 2) {
series.fillBetween = "id" + (id + 1);
series.lines.fill = true;
}
id++;
}]
}
})()
</f:facet>
Unfortunately Flot calls the hook on each series separately, that's why we need to keep track of the id.
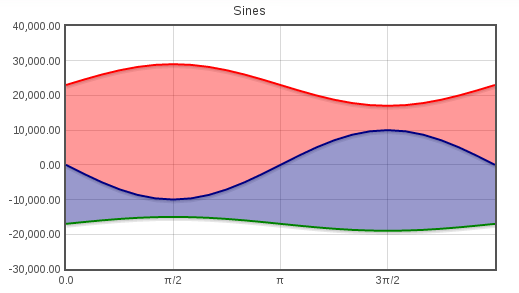
Label formatting
Another thing the hooks can be used for is formatting of axis labels, we can either format the values calculated by Flot or we can add our own values:
<f:facet name="hooks">
(function() {
var id = 0;
return {
processRawData: [function(plot,series) {
series.id = "id" + id;
if (id < 2) {
series.fillBetween = "id" + (id + 1);
series.lines.fill = true;
}
id++;
}],
processOptions: [function(plot,options) {
options.yaxes[0].tickFormatter = function (value, axis) {
return (value * 10000).toLocaleString('en-US', {minimumFractionDigits: 2});
};
options.xaxes[0].ticks = [
0, [ Math.PI/2, "\u03c0/2" ], [ Math.PI, "\u03c0" ],
[ Math.PI * 3/2, "3\u03c0/2" ], [ Math.PI * 2, "2\u03c0" ]
];
}]
}
})()
</f:facet>