Skip navigation
2014

Taken from Lukáš Macko's blog series on charts, this is an up-to-date version.


Handling events of the chart component


My introduction set of posts about the chart component is coming to end. I have already covered creating a basic chart, chart types supported, customization of chart look and component’s JavaScript API. One of thing I haven’t explained is handling of the chart component events.


The chart component offers three events to be handled.

  • plotclick – fired when point in a chart is been clicked
  • plothover – mouse cursor is above  the point
  • mouseout – mouse cursor leaves chart grid


Each of events can be handled by JavaScript function. The PlotClick event can be assigned a server-side listener also. A listener or JavaScript handling function is given information about fired event:

  • seriesIndex – index of series whose point firing event belongs to
  • dataIndex – point index inside the series
  • x – point value on x-axis
  • y – point values on y-axis
  • item - javascript object holding other information about the event such as series label (only javascript)

Note: This information is not relevant for the mouseout event.


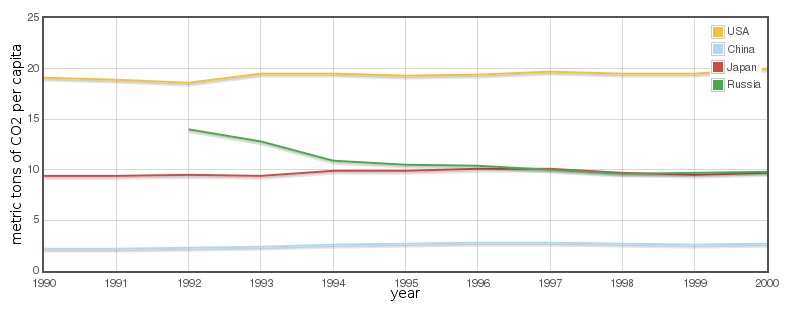
Let’s move to an example. I am going to use following chart.

<rich:chart>
    <a4j:repeat value="#{eventBean.countries}" var="country" >
         <rich:chartSeries label="#{country.name}" type="line">
             <a4j:repeat value="#{country.data}" var="record">
                 <rich:chartPoint x="#{record.year}" y="#{record.tons}" />
             </a4j:repeat>
         </rich:chartSeries>
    </a4j:repeat>
    <rich:chartXAxis  label="year"/>
    <rich:chartYAxis label="metric tons of CO2 per capita"/>
</rich:chart>

Client-side handlers

In first example I would like to show how to handle plotclick event. I am going to create a simple JavaScript function which will change the text in <span> element showing information about the point clicked.


At first add the span element, identify it with id attribute.


<span id='clickInfo'></span>


Create function which updates the span text.


<script type='text/javascript'>
        //<![CDATA[
           function log(e){
               $('#clickInfo').text("Series index: "+
                     e.data.seriesIndex +" DataIndex: "+
                     e.data.dataIndex+' ['+e.data.x+','+e.data.y+']');
           }

        //]]>
    </script>


Set handler in chart attribute attribute name is on+eventName, where eventName is one of plotclick, plothover or mouseout.


<rich:chart onplotclick="log(event)" >


JavaScript handler function is given an event object holding information mentioned above. They are located in data property. To access them use


e.data.seriesIndex
e.data.dataIndex
e.data.x
e.data.y
e.data.item.series.label


The similar approach might be used to handle plothover and mouseout events.


Server-side listener


To handle event you can also set server-side listener. I am going to use the same simple example setting a text after firing event.


<h:form>
    <rich:chart clickListener="#{eventBean.handler}">
         <a4j:repeat value="#{eventBean.countries}" var="country" >
             <rich:chartSeries label="#{country.name}" type="line">
                 <a4j:repeat value="#{country.data}" var="record">
                     <rich:chartPoint x="#{record.year}" y="#{record.tons}" />
                 </a4j:repeat>
             </rich:chartSeries>
         </a4j:repeat>
         <a4j:ajax event="plotclick" render="msg" execute="msg"/>
         <rich:chartXAxis label="year"/>
         <rich:chartYAxis label="metric tons of CO2 per capita"/>
    </rich:chart>
    <h:outputText id="msg" value="#{eventBean.msg}"/>
</h:form>


To be able to use server-side listener you have to surround the chart tag by the form. There is also added outputText showing the String updated by server-side listener. <a4j:ajax> tag set the outputText to be rerendered after the plotclick event.


The server-side listener is given an instance of plotclick object which contains the same information as client side object except item object.


public void handler(PlotClickEvent event){
    msg="Server's speaking:"+event.toString();
}


The setting of server-side listener is done by attribute clickListener.


Online demo can be found here and bean source code is on github.


Particular series handler

If you want to handle event fired by particular series only you can set handler for the one series only by using attribute in series tag. The name is the same as in chart tag.


Note: mouseout event handler is available only in chart tag.


Links

Taken from Lukáš Macko's blog series on charts, this is an up-to-date version.


How to customize the chart look


This post explains how to customize chart created by RichFaces chart component. The first steps how to create basic chart and chart types supported can be found in previous posts. If you’ve read some of these blog or API design proposal, you know that chart component uses a hierarchical tag structure. It means that chart configuration is divided into several tags. Each of them customizes a part of the chart.


<rich:chart>
   <rich:chartSeries type="line">
      <a4j:repeat value="" var="">
         <rich:chartPoint x="" y=""/>
      </a4j:repeat>
   </rich:chartSeries>
   <rich:chartXAxis/>
   <rich:chartYAxis/>
   <rich:chartLegend/>
</rich:chart>


The general chart structure is shown above. I’ll run through tags and their attributes. All attributes are optional except the ones mentioned above type, x and y.


rich:chart

  • title – text shown above the chart (not styled properly yet)
  • styleClass – css class assigned to a chart div
  • zoom – set true to enable zooming (works on line chart) you can reset zoom throught JavaScript API
  • eventHandlers: onplotclick, onmouseover, onmouseout, clickListener explained in detail in event handling post


rich:chartSeries

  • type – required attribute selects the chart type. Allowed values are line, bar and pie
  • symbol – selects point symbol in line chart (the attribute is ignored by other chart type) allowed values are circle, square, cross, triangle, diamond
  • color – defines series color (works with line and bar chart)
  • data – it used to pass data into component when you fill dataModel by your self explained in data model post
  • eventHandlers for particular series. See event handler post


rich:chartXAxis, rich:chartYAxis

  • format – currently used only by date series
  • label – axis description show next to axis
  • min – the smallest value shown on axis
  • max – the biggest values shown on axis
  • pad – if you don’t want to set fixed min and max value you can use this attribute it definesthe fraction of margin that the scaling algorithm will add to avoid that the outermost points ends up on the grid border.


rich:chartLegend

  • position – where the legend should be placed. Allowed values are nw (top left), sw (bottom left), ne (top right), se (bottom right)
  • sorting – defines the rule how the labels in legend are ordered. If not set they are in order asi defined in facelet. If you want to order them alphabetically you can use ascending or descending option.


Chart JavaScript API


The chart component it is built above the jQuery widget factory, so it offers also JavaScript API. Handling JavaScript events I’ll cover in another post. Component’s JavaScript API offers for now two public methods.


getPlotObject – used for testing returns JavaScript plot object


resetZoom is used to reset axis ranges and display whole chart after zooming is done. I’ll demonstrate it in a small example.


<rich:chart id="myChart" zoom="true" >
  <rich:chartLegend sorting="ascending"/>
  <a4j:repeat value="#{bean.series}" var="s">
    <rich:chartSeries type="line" label="#{s.label}" >
       <a4j:repeat value="#{s.data}" var="point">
          <rich:chartPoint x="#{point.x}" y="#{point.y}" />
       </a4j:repeat>
    </rich:chartSeries>
  </a4j:repeat>
</rich:chart>


To call a method on a particular chart you use id attribute.


RichFaces.component("form:myChart").resetZoom()

Example above calls method resetZoom on a chart identified by ID myChart. You can see live example here. (Note: the example is not up-to-date)


There is one more method not implemented yet highlight. It should allow to programmatically highlight a point in a series.


Links

Taken from Lukáš Macko's blog series on charts, this is an up-to-date version.


Chart component


The chart component has landed in RichFaces. Let’s take a quick look how to use it.


chart.png


I am going to show steps how to create chart like this. It shows countries carbon dioxide emissions per capita in several years. I am going to use following data. Data are stored in a list of Country objects in a backing bean.


public class Country{
    private String name;
    //CO2 production year-> metric tons per capita
    private List<Record> data;

    public Country(String name){
        this.name = name;
        this.data = new LinkedList<Record>();
    }
    public void put(int year, double tons){
        this.data.add(new Record(year, tons));
    }

    public List<Record> getData() {
        return data;
    }

    public String getName() {
        return name;
    }

    public class Record{
        private int year;
        private double tons;

        public Record(int year, double tons) {
            this.year = year;
            this.tons = tons;
        }

        public double getTons() {
            return tons;
        }

        public int getYear() {
            return year;
        }
    }
}


Country object has name and list of records (year and tons of C02 produced in that year by the country)


Prerequisite: Create JSF maven project (I am not going to dive in details.) with JBOSS public repository enabled.


Create chart

<rich:chart>
   <a4j:repeat value="#{bean.countries}" var="country" >
      <rich:chartSeries label="#{country.name}" type="line">
         <a4j:repeat value="#{country.data}" var="record">
            <rich:chartPoint x="#{record.year}" y="#{record.tons}" />
         </a4j:repeat>
      </rich:chartSeries>
   </a4j:repeat>
   <rich:chartXAxis label="year"/>
   <rich:chartYAxis label="metric tons of CO2 per capita"/>
</rich:chart>


I’ll explain these lines in details. You don’t have to create any extra java Object and fill it. You just pass what you gain from database or wherever and use it. In our case we have backing bean called bean and there is a list of Country objects storing data named countries.


Tag chartSeries represents one line in our chart – the values for one country. It has one mandatory attribute type defining the look of chart. It selects whether the chart displays line, bar or pie.


As you probably noticed, there is missing data in series tag. Data is passed into the series using tag chartPoint. It express one key-value pair/ x,y coordinates of a point in that line.


Tag repeat iterates over an array and it “generates” tags for you. That’s why you see only one series in a facelet and for lines in a chart. The same approach is used with points of each series.


Note: If you prefer more traditional  way. You can create chart data model by your self and pass it into the series tag using data attribute. It’ll be shown in another blog.


The source code of the shown example can be found here.


What chart type does component offer?


In this post I am going to describe what types of chart the component allow to create, how to switch among them and other things you should know about it.


The component supports line, bar and pie chart at the moment. The switching among chart type is easy, you change series tag attribute type to corresponding value.

<rich:chart>
   <rich:chartSeries type="line">
      <a4j:repeat value="" var="">
         <rich:chartPoint x="" y=""/>
      </a4j:repeat>
   </rich:chartSeries>
</rich:chart>


Each type expects Number type in y attribute. Line chart allows to use Number and Date (not fully supported yet) type in x attribute. Bar chart allows to use Number, String and Date (not fully supported yet). Pie chart use only String in x attribute.


Line and bar chart allow to use more than one series in a chart if the same type is used in x axis. You can also combine bar and line chart.


Switching among chart types get a little more complicated when you create data model by your self but it is topic for another post.


Links

In RichFaces 4.5 we've upgraded the rich:fileUpload component to take advantage of new APIs both on client and server side.


These changes are mostly in the background. The two visible changes are differently styled progress bars (based on Bootstrap) and the ability to drag and drop files onto the component. However the new APIs really simplified the somewhat difficult task of submitting and processing the files and are worth a few lines:


File API

A new API comes to browsers with HTML5, allowing access to the files provided by the user

input.val();
// "C:\fakepath\chart1.png"


The "C:\fakepath" is obfuscation by the browser, this is the only valuable information we can retrieve from an <input type="file" />, but with File API we can do better


input.prop("files")[0];
/* File: {
    lastModifiedDate: Mon Sep 29 2014 13:35:47 GMT+0200 (CEST)
    name: "chart1.png"
    size: 14679
    type: "image/png"
} */


Drag and Drop

With the File API and drag and drop support we can also retrieve files from a dropEvent (event.dataTransfer.files). The dropEvent can be intercepted on any element so it is possible to implement a file upload without the use of a file input.


XmlHttpRequest Level 2

The second important change in HTML5 is the FormData interface that let's us create a form-like object to be sent by an AJAX request. In this case we can append the files we retrieved previously to that object. Without access to any kind of File representation, the way to get the file to the server was to submit the form, loading the result into an <iframe> and intercepting the AJAX response to apply the changes to the main page.


var formData = new FormData(form);

formData.append(fileUpload.id, file); // key-value mapping
this.xhr = new XMLHttpRequest();
this.xhr.open('POST', url, true);

/*
  xhr handlers
   …
*/
this.xhr.send(formData);


there are several other things that have to be taken care of with regards to JSF but those are above the scope of this post.


XHR also allows us to handle the progress of the file upload on the client side. Previously we had to handle it on the server, inserting rich:progressBar into the element during rerender and connecting it to a request parser through a JSON resource.

this.xhr.upload.onprogress = function(e) {
    if (e.lengthComputable) {
        var progress = Math.floor((e.loaded / e.total) * 100);
        /*
          update the progressbar 
          …
        */
    }
};


NOTE: these APIs and thus the fileUpload component are not supported by older browsers, most notably IE9


Servlet 3.0

On the server side the big change was the implementation Servlet 3.0, making it easier to process the incoming request.


Collection<Part> parts = request.getParts();

for (Part part : parts) {
    // one of the parts will be the file we appended to formData
    String contentDisposition = part.getHeader("Content-Disposition");
    // form-data; name="form:upload"; filename="chart1.png"
    String filename = MultipartRequestParser.parseFileName(contentDisposition);
    if (filename != null) {
        files.add(new UploadedFile30(part.getName(), filename, part));
        // the file is then retrieved through part.getInputStream()
    }
}


We still support Servlet 2.5 which doesn't provide access to the parts, in that case the entire request has to be parsed piece by piece.


Links

Filter Blog

By date:
By tag: