This content has been marked as final.
Show 6 replies
-
1. Re: Graphs, lots of "no data" columns...
john.sanda Oct 30, 2014 3:18 PM (in response to kucerarichard) 1 of 1 people found this helpful
Hi Rich,
I would expect this to be a server-side, backend issue. Here are some questions to help track down the problem.
How many servers, storage nodes are you running?
Has your server (or servers) been down for any extended length of time?
Do you have errors in your server.log, particularly around reading/writing metric data?
What date ranges are you using for the graphs?
-
2. Re: Graphs, lots of "no data" columns...
pilhuhn Oct 30, 2014 3:20 PM (in response to kucerarichard) 1 of 1 people found this helpful
Rich,
if you are running JBoss ON 3.2.0.GA then please apply the latest CP, which is CP3. Otherwise (and/or in addition) please contact support.
-
3. Re: Graphs, lots of "no data" columns...
kucerarichard Oct 30, 2014 4:19 PM (in response to kucerarichard)
Thanks both for quick reply. I increased the heap due to what was suggested in the storage log. I didn't see anything else in the logs.
I will get the CP3 as soon as I can, and contact support.
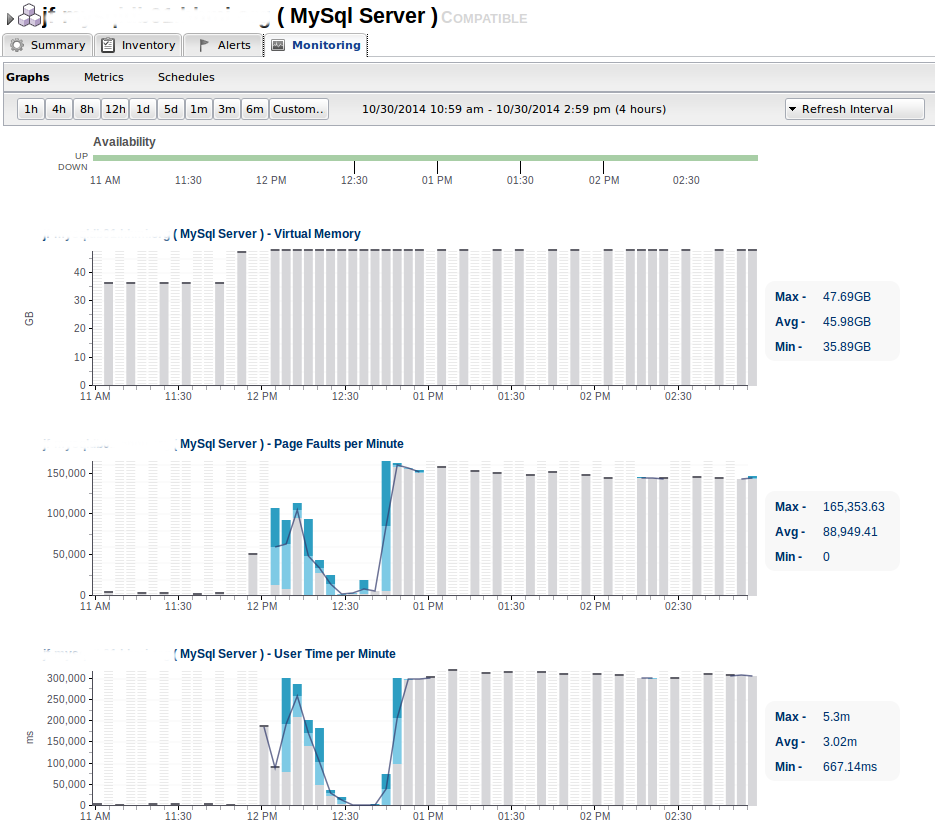
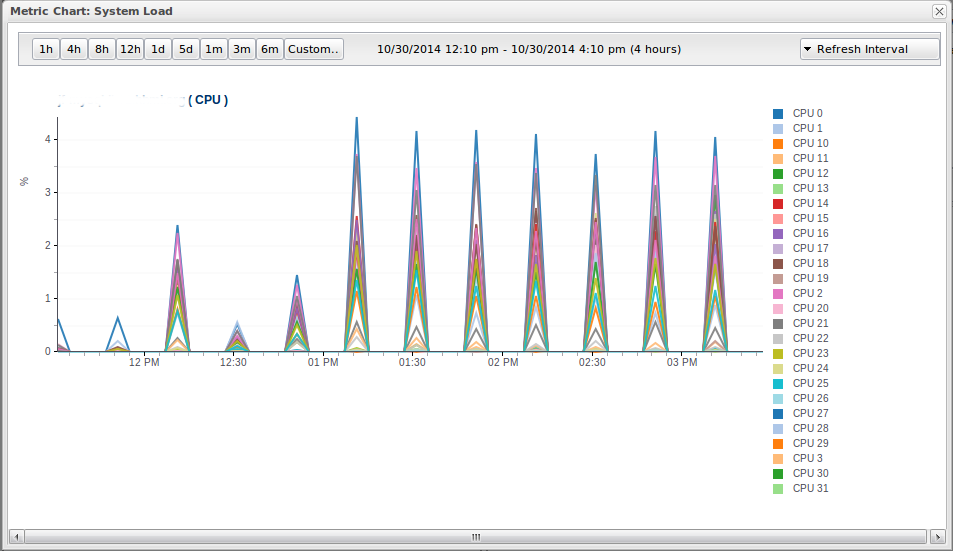
Attached here is another image that more clearly shows the problem with the data, those should be line graphs going across the page:
-
4. Re: Graphs, lots of "no data" columns...
mithomps Oct 30, 2014 4:53 PM (in response to kucerarichard)
Hi Rich,
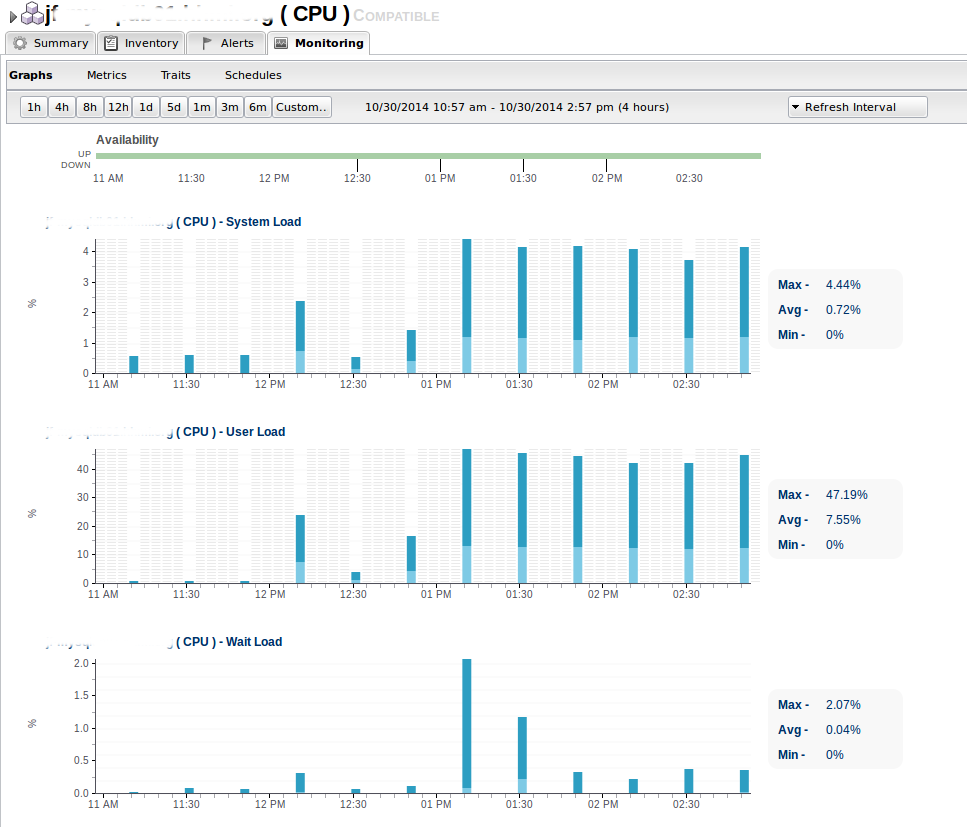
It looks like the collection schedules are just higher than what you want. For CPU I think the default is 20 minutes which appears to fit from the looks of the graph above. Change the collection interval down to one or five minutes and I think the graph will smooth out and your data points fill up.
-
5. Re: Graphs, lots of "no data" columns...
kucerarichard Oct 30, 2014 5:24 PM (in response to kucerarichard)
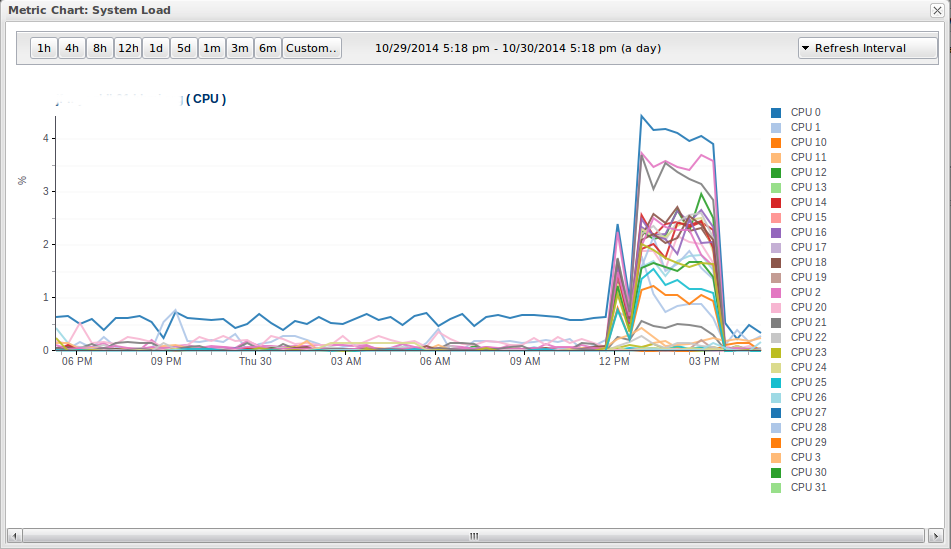
yeah thanks he he... I just validated the answer by setting the graph length up to a day... but I do need to interact with these forums, CP3 is good, and to practice reading logs whenever possible...
Here is what it looks like with proper graph length that matches the collection interval...

-
6. Re: Graphs, lots of "no data" columns...
mithomps Oct 30, 2014 5:28 PM (in response to kucerarichard)
Excellent! Great to hear!