Skip navigation
This project is read only now. Read more.

jBeret

7 posts

WildFly 18 was successfully released in October, 2019.  Among many features and improvements implemented in this release is more fine-grained configuration of ejb3 subsystem thread pool.  In this blog post, I'll walk through this feature and its benefits to application and server configuration.


Comparison of EJB Thread Pool Behavior


A WildFly ejb thread pool consists of core threads and non-core threads.  In previous versions (before WildFly 18), users can configure the maximum number of threads, but cannot configure the number of core threads, which is always set the the same value as maximum number of all threads.  This deficiency is fixed in WildFly 18 with the ability to configure number of core threads and maximum threads independently.  The following table illustrates key differences between previous and current versions of WildFly ejb thread pool:


Before WildFly 18
WildFly 18 and later
max-threads is configurable, but core-threads is not configurable and always equals to max-threadscore-threads and max-threads can be configured independently
Upon new request, new threads are created up to the limit of max-threads, even though idle threads are availableAvailable threads are reused as much as possible, without unnecessary creation of new threads
Idle threads are not timed out, and keepalive-timeout is ignoredIdle non-core threads can time out after keepalive-timeout duration
Incoming tasks are queued after core threads are used upnon-core threads are created and used after core threads are saturated to service new requests


Common CLI Commands to Configure EJB Thread Pool


Users typically configure EJB thread pool through WildFly CLI or admin console.  The following are some common tasks for managing ejb thread pool:


To start WildFly standalone server instance:

cd $JBOSS_HOME/bin
./standalone.sh


To start WildFly CLI program and connect to the target running WildFly server:

$JBOSS_HOME/bin/jboss-cli.sh --connect


Once the CLI program is started, you can then run CLI sub-commands in the CLI shell.  To view the default ejb thread pool configuration:

/subsystem=ejb3/thread-pool=default:read-resource
{
    "outcome" => "success",
    "result" => {
        "core-threads" => undefined,
        "keepalive-time" => {
            "time" => 60L,
            "unit" => "SECONDS"
        },
        "max-threads" => 10,
        "name" => "default",
        "thread-factory" => undefined
    }
}


To view default ejb thread pool configuration and its runtime metrics:

/subsystem=ejb3/thread-pool=default:read-resource(include-runtime, recursive=true)
{
    "outcome" => "success",
    "result" => {
        "active-count" => 0,
        "completed-task-count" => 640L,
        "core-threads" => undefined,
        "current-thread-count" => 4,
        "keepalive-time" => {
            "time" => 60L,
            "unit" => "SECONDS"
        },
        "largest-thread-count" => 4,
        "max-threads" => 10,
        "name" => "default",
        "queue-size" => 0,
        "rejected-count" => 0,
        "task-count" => 636L,
        "thread-factory" => undefined
    }
}


To configure the number of core threads in default thread pool:

/subsystem=ejb3/thread-pool=default:write-attribute(name=core-threads, value=5)
{"outcome" => "success"}


To read the number of core threads in default thread pool:

/subsystem=ejb3/thread-pool=default:read-attribute(name=core-threads)
{
    "outcome" => "success",
    "result" => 5
}


To set the idle timeout value for non-core threads to 5 minutes:

/subsystem=ejb3/thread-pool=default:write-attribute(name=keepalive-time, value={time=5, unit=MINUTES})
{"outcome" => "success"}


You can also set the time value alone while keeping time unit unchanged (or set time unit alone):

/subsystem=ejb3/thread-pool=default:write-attribute(name=keepalive-time.time, value=10)
{"outcome" => "success"}


Server Configuration File


WildFly configuration is saved in server configuration files, and the default standalone instance configuration is located at $JBOSS_HOME/standalone/configuration/standalone.xml.  The following is a snippet of relevant to ejb thread pool configuration:


<subsystem xmlns="urn:jboss:domain:ejb3:6.0">
    <async thread-pool-name="default"/>
    <timer-service thread-pool-name="default" ...>
        ...
    </timer-service>
    <remote thread-pool-name="default" ...>
        ...
    </remote>
    <thread-pools>
        <thread-pool name="default">
            <max-threads count="10"/>
            <core-threads count="5"/>
            <keepalive-time time="10" unit="minutes"/>
        </thread-pool>
    </thread-pools>
</subsystem>


In the above configurtion, a thread-pool named default is defined to contain a maximum of 10 thread in total, a maximum of 5 core-threads, and non-core threads are eligible for removal after being idle for 10 minutes.  This thread pool is used by the ejb container to process async and remote EJB invocation, and timer callback.


Testing EJB Thread Pool


To see EJB thread pool in action, simply deploy a jar file containing the following bean class to WildFly, and check the application logs, which shows the name of the thread processing timer timeout event.


package test;

import javax.ejb.*;
import java.util.logging.Logger;

@Startup
@Singleton
public class ScheduleSingleton {
    private Logger log = Logger.getLogger(ScheduleSingleton.class.getSimpleName());

    @Schedule(second="*/1", minute="*", hour="*", persistent=false)
    public void timer1(Timer t) {
        log.info("timer1 fired at 1 sec interval ");
    }

    @Schedule(second="*/2", minute="*", hour="*", persistent=false)
    public void timer2(Timer t) {
        log.info("timer2 fired at 2 sec interval ");
    }
}


The above bean class defines a singleton session bean with eager initialization.  2 automatic calendar-based timers are created upon application initialization.  timer1 will fire every 1 second, and timer2 will fire every 2 seconds.


After compiling and packaing this bean class to a jar file, deploy it to running WildFly server:

$JBOSS_HOME/bin/jboss-cli.sh -c "deploy --force schedule-timer-not-persistent.jar"


Once deployed, the following output will logged in console and server log file:


09:00:30,272 INFO  [org.jboss.as.server] (management-handler-thread - 1) WFLYSRV0010: Deployed "schedule-timer-not-persistent.jar" (runtime-name : "schedule-timer-not-persistent.jar")
09:00:31,025 INFO  [ScheduleSingleton] (EJB default - 1) timer1 fired at 1 sec interval
09:00:32,007 INFO  [ScheduleSingleton] (EJB default - 1) timer2 fired at 2 sec interval
09:00:32,009 INFO  [ScheduleSingleton] (EJB default - 2) timer1 fired at 1 sec interval
09:00:33,006 INFO  [ScheduleSingleton] (EJB default - 2) timer1 fired at 1 sec interval
09:00:34,007 INFO  [ScheduleSingleton] (EJB default - 1) timer1 fired at 1 sec interval
09:00:34,012 INFO  [ScheduleSingleton] (EJB default - 2) timer2 fired at 2 sec interval


(EJB default - 1) and (EJB default - 2) indicates thread 1 and 2 from EJB thread pool named default are processing timer timeout event. Althogh there are infinite timeout events, only those 2 core threads are needed to handle these tasks.


You can also verify this behavior by looking at thread pool runtime metrics:


/subsystem=ejb3/thread-pool=default:read-resource(include-runtime, recursive=true)
{
    "outcome" => "success",
    "result" => {
        "completed-task-count" => 88L,
        "core-threads" => 5,
        "current-thread-count" => 2,
        "largest-thread-count" => 2,
        "max-threads" => 10,
        ...
    }
}


Notice that only 2 core threads are created with no non-core threads, to complete 88 timeout tasks.


Ater testing, undeploy the ejb application so that no more timers are scheduled:

$JBOSS_HOME/bin/jboss-cli.sh -c "undeploy schedule-timer-not-persistent.jar"


More Resources:


I hope this post is useful to your application development and management with WildFly.  Comments, feedback and contribution are always welcome and appreciated. For more information, please check out following links and other resources from WildFly, jboss and Red Hat.


WildFly project home page

WildFly project source code repo

WildFly Community Documentation
WildFly Developer and User Forum

WildFly JIRA

In a batch processing framework, job repository fulfills the need for storing batch job processing data, such as job instance, job execution, step execution, step partition execution, and various metrics.  JBeret implements in-memory, JDBC, MongoDB and Infinispan job repository types to meet different application requirements.  From the user feedback from last couple of years, JDBC stands out as the most commonly used job repository type.  In a previous blog post, I wrote about using PostgreSQL JDBC job repository in WildFly.  In this post, I will expand this topic to walk through how to use JDBC job repository backed by another popular open-source database product: MySQL.  MySQL 8 was released in April 2018, 2.5 years after the previous major release 5.7.  So it's a good time to try out MySQL 8 with JBeret.


Basic Operations with MySQL


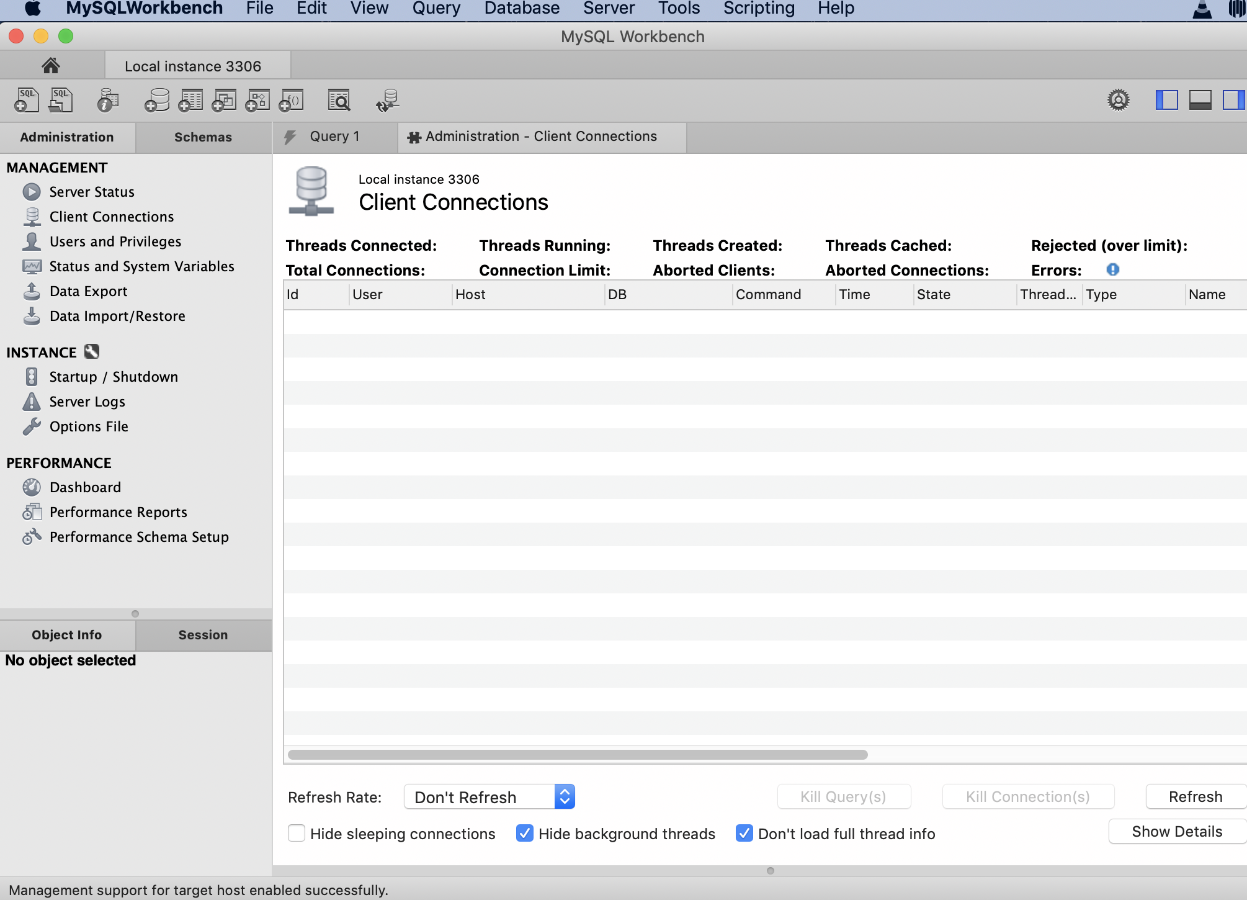
First of all, let's start with some basic operations with MySQL, such as starting and stopping the database server, running the CLI mysql client program and the GUI client tool MySQL Workbench.  I'm using MySQL version 8.0.15, the latest stable release at the time of writing.  I will start it in my local machine and also connect it locally as MySQL user root without password.


To start MySQL database server:

$ mysql.server start
Starting MySQL
. SUCCESS!


To stop MySQL database server:

$ mysql.server stop
Shutting down MySQL
.. SUCCESS!


To perform simple client operations from CLI tool, mysql:


$ mysql -uroot
Welcome to the MySQL monitor.  Commands end with ; or \g.
Your MySQL connection id is 8
Server version: 8.0.15 Homebrew

Copyright (c) 2000, 2019, Oracle and/or its affiliates. All rights reserved.

Oracle is a registered trademark of Oracle Corporation and/or its
affiliates. Other names may be trademarks of their respective
owners.

Type 'help;' or '\h' for help. Type '\c' to clear the current input statement.

mysql> show databases;
+--------------------+
| Database           |
+--------------------+
| information_schema |
| mysql              |
| performance_schema |
| sys                |
+--------------------+
4 rows in set (0.01 sec)

mysql> create database test;
Query OK, 1 row affected (0.00 sec)

mysql> use test;
Database changed
mysql> show tables;
Empty set (0.00 sec)


In the above mysql session, I just created a database named test, which will be used as the target database of jberet job repository.  To exit from mysql client session, type command "quite;", or simply press Ctrl-D.


If you prefer GUI to CLI, MySQLWorkbench offers a powerful yet easy-to-use client tool.

MySQLWorkbench


Configure MySQL JDBC Job Repository in JBeret Standalone in Java SE environment


JBeret standalone by default uses H2 database.  To change to MySQL, simply follow the following steps:


1, edit jberet.properties file, which is the configuration file for JBeret standalone in Java SE environment, and should reside in the class path of your batch application.  In JBeret zip distribution, it is at JBERET_INSTALL_DIR/bin/jberet.properties.


db-url = jdbc:mysql://localhost:3306/test
db-user = root
db-password =
db-properties = sslMode=DISABLED


2, include MySQL JDBC driver jar in the runtime classpath of your batch application.  For maven-based project, simply configure the following dependency on MySQL Java connector:

<dependency>
  <groupId>mysql</groupId>
  <artifactId>mysql-connector-java</artifactId>
  <version>8.0.15</version>
</dependency>


Troubleshooting


Some common errors you may run into while connecting to MySQL database server from your batch application:


1, JDBC jar not found


Caused by: java.sql.SQLException: No suitable driver found for jdbc:mysql://localhost:3306/test
        at java.sql/java.sql.DriverManager.getConnection(DriverManager.java:702)
        at java.sql/java.sql.DriverManager.getConnection(DriverManager.java:189)
        at org.jberet.repository.JdbcRepository.getConnection(JdbcRepository.java:1021)


The above error means MySQL Java Connector jar is not in runtime classpath, and you will need to double check the jar path and file names.


2, Unable to load authentication plugin


Caused by: java.sql.SQLException: Unable to load authentication plugin 'caching_sha2_password'.
        at com.mysql.jdbc.SQLError.createSQLException(SQLError.java:880)
        at com.mysql.jdbc.SQLError.createSQLException(SQLError.java:876)
        at com.mysql.jdbc.MysqlIO.proceedHandshakeWithPluggableAuthentication(MysqlIO.java:1690)
        at com.mysql.jdbc.MysqlIO.doHandshake(MysqlIO.java:1207)
        at com.mysql.jdbc.ConnectionImpl.coreConnect(ConnectionImpl.java:2249)
        at com.mysql.jdbc.ConnectionImpl.connectOneTryOnly(ConnectionImpl.java:2280)
        at com.mysql.jdbc.ConnectionImpl.createNewIO(ConnectionImpl.java:2079)
        at com.mysql.jdbc.ConnectionImpl.(ConnectionImpl.java:794)
        at com.mysql.jdbc.JDBC4Connection.(JDBC4Connection.java:44)


The above error is usually caused by older version of MySQL Java Connector trying to talk to newer version of MySQL database server.  Upgrading your client-side MySQL Java Connector to match the server side will resolve this problem.  For more technical details, see MySQL docs.


3, SSLException when running with Java 11


javax.net.ssl.SSLException
MESSAGE: closing inbound before receiving peer's close_notify
   
STACKTRACE:
javax.net.ssl.SSLException: closing inbound before receiving peer's close_notify
        at java.base/sun.security.ssl.Alert.createSSLException(Alert.java:129)
        at java.base/sun.security.ssl.Alert.createSSLException(Alert.java:117)
        at java.base/sun.security.ssl.TransportContext.fatal(TransportContext.java:308)
        at java.base/sun.security.ssl.TransportContext.fatal(TransportContext.java:264)
        at java.base/sun.security.ssl.TransportContext.fatal(TransportContext.java:255)
        at java.base/sun.security.ssl.SSLSocketImpl.shutdownInput(SSLSocketImpl.java:645)
        at java.base/sun.security.ssl.SSLSocketImpl.shutdownInput(SSLSocketImpl.java:624)
        at com.mysql.cj.protocol.a.NativeProtocol.quit(NativeProtocol.java:1319)
        at com.mysql.cj.NativeSession.quit(NativeSession.java:182)
        at com.mysql.cj.jdbc.ConnectionImpl.realClose(ConnectionImpl.java:1750)
        at com.mysql.cj.jdbc.ConnectionImpl.close(ConnectionImpl.java:720)
        at org.jberet.repository.JdbcRepository.close(JdbcRepository.java:1055)
        at org.jberet.repository.JdbcRepository.updateJobExecution(JdbcRepository.java:497)


The above SSLException is logged when running with Java 11 and connecting to MySQL server without disabling ssl.  It does not affect batch job execution, though.  It does not occur with Java 10.  To avoid it in Java 11, make sure the db-properties is set to "sslMode=DISABLED" in jberet.properties.


Query Batch Job Data with MySQL Client Tool


Batch application can query job execution data and perform job operations through the standard JobOperator API, which should be the perferred way of interacting with the underlying job repository.  However, directly querying job repository database can be a valuable complement to the standard JobOperator API.


To view available tables in postgres database:


mysql> show tables;
+---------------------+
| Tables_in_test      |
+---------------------+
| JOB_EXECUTION       |
| JOB_INSTANCE        |
| PARTITION_EXECUTION |
| STEP_EXECUTION      |
+---------------------+
4 rows in set (0.00 sec)


To display the structure of a particular table:


mysql> describe JOB_INSTANCE;
+-----------------+--------------+------+-----+---------+----------------+
| Field           | Type         | Null | Key | Default | Extra          |
+-----------------+--------------+------+-----+---------+----------------+
| JOBINSTANCEID   | bigint(20)   | NO   | PRI | NULL    | auto_increment |
| VERSION         | int(11)      | YES  |     | NULL    |                |
| JOBNAME         | varchar(512) | YES  |     | NULL    |                |
| APPLICATIONNAME | varchar(512) | YES  |     | NULL    |                |
+-----------------+--------------+------+-----+---------+----------------+
4 rows in set (0.00 sec)


To query job execution data in chronological order:


mysql> select jobexecutionid, endtime, batchstatus from job_execution order by jobexecutionid desc limit 10;
+----------------+---------------------+-------------+
| jobexecutionid | endtime             | batchstatus |
+----------------+---------------------+-------------+
|            937 | 2019-02-24 18:17:48 | COMPLETED   |
|            936 | 2019-02-24 18:17:48 | STOPPED     |
|            935 | 2019-02-24 18:17:46 | COMPLETED   |
|            934 | 2019-02-24 18:17:46 | FAILED      |
|            933 | 2019-02-24 18:17:46 | COMPLETED   |
|            932 | 2019-02-24 18:17:46 | COMPLETED   |
|            931 | 2019-02-24 18:17:46 | COMPLETED   |
|            930 | 2019-02-24 18:17:46 | STOPPED     |
|            929 | 2019-02-24 18:17:46 | COMPLETED   |
|            928 | 2019-02-24 18:17:46 | COMPLETED   |
+----------------+---------------------+-------------+
10 rows in set (0.00 sec)


To view job instance data:


mysql> select * from job_instance order by jobinstanceid desc limit 5;
+---------------+---------+--------------------------+-----------------+
| JOBINSTANCEID | VERSION | JOBNAME                  | APPLICATIONNAME |
+---------------+---------+--------------------------+-----------------+
|           732 |    NULL | job_batchlet_longrunning | NULL            |
|           731 |    NULL | job_batchlet_longrunning | NULL            |
|           730 |    NULL | job1                     | NULL            |
|           729 |    NULL | job1                     | NULL            |
|           728 |    NULL | job1                     | NULL            |
+---------------+---------+--------------------------+-----------------+
5 rows in set (0.00 sec)


To view step execution data:


mysql> select stepexecutionid, stepname, starttime, batchstatus, commitcount from step_execution order by stepexecutionid desc limit 10;
+-----------------+----------+---------------------+-------------+-------------+
| stepexecutionid | stepname | starttime           | batchstatus | commitcount |
+-----------------+----------+---------------------+-------------+-------------+
|            1440 | step2    | 2019-02-24 18:17:48 | COMPLETED   |           0 |
|            1439 | step1    | 2019-02-24 18:17:48 | COMPLETED   |           0 |
|            1438 | step1    | 2019-02-24 18:17:46 | STOPPED     |           0 |
|            1437 | step2    | 2019-02-24 18:17:46 | COMPLETED   |           0 |
|            1436 | step1    | 2019-02-24 18:17:46 | COMPLETED   |           0 |
|            1435 | step1    | 2019-02-24 18:17:46 | FAILED      |           0 |
|            1434 | step1    | 2019-02-24 18:17:46 | COMPLETED   |           0 |
|            1433 | step1    | 2019-02-24 18:17:46 | COMPLETED   |           0 |
|            1432 | step1    | 2019-02-24 18:17:46 | COMPLETED   |           0 |
|            1431 | step1    | 2019-02-24 18:17:46 | COMPLETED   |           0 |
+-----------------+----------+---------------------+-------------+-------------+
10 rows in set (0.00 sec)

Introduction


This blog post is the part of the series that showcase some of the work in JBeret family projects for modernizing Java batch processing.  Previously, we've discussed how to move your batch processing workload developed for Java SE standalone environment (see this post) and Java EE platform (see this post) to PaaS such as OpenShift.  They serve as good proof that standard-based batch applications can run with Java SE and Java EE (now Jakarta EE) both locally on bare meta and on cloud platform.


While it is great to be able to choose from either Java SE or Java EE environment for batch application, you may be wondering if it is possible to take advantage of both: leverage the lightweightness and flexibility of Java SE, and also the wide range of platform service in Java EE.  The answer is yes.  With the advent of Eclipse MicroProfile, the new opensource enterprise Java standard for microservices architecture, this type of usecase is well supported.  In this post, we will explore how to build and run microservices batch application with Thorntail (an implementation of Eclipse MicroProfile) both locally and on OpenShift.  We will be using numbers-chunk-thorntail, a fully functional sample batch application with Thorntail, to illustrate the steps.


Build and Run Thorntail-based Batch Application Locally


First, let's see how to build and run the sample application the traditionaly way locally, and familiarize ourselves with the application structure and batch job.  numbers-chunk-thorntail is a Java EE batch processing application and contains a single batch job as defined in numbers.xml.  Additionally, the project pom.xml declares Thorntail-related dependencies and plugins that enhance the regular WAR file into executable Thorntail-style uber jar (fat jar).


The numbers.xml batch job contains a single chunk-type step that reads a list of numbers by chunks and prints them to the console. The 2 batch artifacts used in this application are:


This application also contains a singleton EJB, StartUpBean, which starts execution of batch job numbers.xml upon application deployment and Thorntail server start.


For complete batch job definition, see the JSL file numbers.xml.


To git-clone the sample application from github:

git clone https://github.com/jberet/numbers-chunk-thorntail.git 


To build the sample application with Maven:

mvn clean install  


The above step produces both a regular webapp WAR file, and an executable uber jar (fat jar) containing Thorntail runtime and all dependencies:


The above step produces both a regular webapp WAR file, and an executable uber jar (fat jar) containing

Thorntail runtime and all dependencies:


ls -l target/
-rw-r--r--  1 staff     258412 Sep 29 14:46 numbers-chunk-thorntail.war
-rw-r--r--  1 staff  112089497 Sep 29 14:46 numbers-chunk-thorntail-thorntail.jar


To run the Thorntail-based application locallym, you can either directly run it with the familiar java -jar command, or with mvn:


# Run with java -jar
java -jar target/numbers-chunk-thorntail-thorntail.jar

# Or run with mvn
mvn thorntail:run


The output should show that Thorntail is bootstrapped, batch application deployed, batch job started and completed, and Thorntail server keeps running.

Apart from this automatically started initial batch job execution, you can perform various batch processing operations with RESTful API calls, thanks to jberet-rest included in this application.  For instance, try the following commands in a separate terminal window:


# to start the job named `numbers`
curl -s -X POST -H 'Content-Type:application/json' "http://localhost:8080/api/jobs/numbers/start" | jq

# to get the details and status of the newly started job execution
curl -s "http://localhost:8080/api/jobexecutions/1" | jq

# to get all step executions belonging to this job execution
curl -s "http://localhost:8080/api/jobexecutions/1/stepexecutions" | jq

# to abandon the above job execution
curl -X POST -H 'Content-Type:application/json' "http://localhost:8080/api/jobexecutions/1/abandon"

# to schedule a job execution with initial delay of 1 minute and repeating with 60-minute interval
curl -s -X POST -H 'Content-Type:application/json' -d '{"jobName":"numbers", "initialDelay":1, "interval":60}' "http://localhost:8080/api/jobs/numbers/schedule" | jq

# to list all job schedules
curl -s "http://localhost:8080/api/schedules" | jq

# to cancel a job schedule
curl -s -X POST -H 'Content-Type:application/json' "http://localhost:8080/api/schedules/1/cancel" | jq

# to get details of a job schedule
curl -s "http://localhost:8080/api/schedules/2" | jq


In above commands, a utility program called jq is used to pretty-print the JSON output. Its usage here is equivalent to "python -m json.tool".  To shut down the application, press Ctrl-C in the terminal window of the running application.


Also worth mentioning is Thorntail Project Generator, which can be used to create the scaffold of your application.  It allows you to pick and choose which technologies and frameworks to use, and generates the required maven dependencies and plugins, and key application classes.  This comes handy for quickly starting new Thorntail-based development projects.


Build and Deploy Thorntail-based Batch Application to OpenShift Online


Next let's look at how to build and deploy the same batch application to OpenShift.  OpenShift will need to enlist a Java SE runtime, and here we choose to use openjdk18.  All the operations we will be performing can be done via either OpenShift command line tool (oc), or OpenShift Web Console.  For the sake of brevity, we will use oc commands.  For introduction to various features in OpenShift, you may want to check out OpenShift interactive tutorials.


We assume you already have an OpenShift account, and to log in:

oc login https:xxx.openshift.com --token=xxx  


To create a new project, if there is no existing projects:

oc new-project   


We wil use openjdk18-openshift image stream. Check if it is available in the current project:

oc get is  


If openjdk18-openshift is not present, import it:

oc import-image my-redhat-openjdk-18/openjdk18-openshift --from=registry.access.redhat.com/redhat-openjdk-18/openjdk18-openshift --confirm  


To create a new application (with default name):

oc new-app openjdk18-openshift~https://github.com/jberet/numbers-chunk-thorntail.git  


The above command will take a few minutes to complete, and to watch its status, run the following command:

oc rollout status dc/numbers-chunk-thorntail


To expose `numbers-chunk-thorntail` application to external clients, run the command:

oc expose svc numbers-chunk-thorntail


The above command exposes our batch application service to external client, by creating a route.  To get the route information, filtering by label -l option:

oc get route -l app=numbers-chunk-thorntail


NAME                 HOST/PORT                                                   PATH SERVICES             PORT  TERMINATION   WILDCARD
numbers-chunk-thorntail   numbers-chunk-thorntail-pr.xxxx.xxxx.openshiftapps.com        numbers-chunk-thorntail   8080-tcp            None


Scale Thorntail-based Batch Application on OpenShift


OpenShift makes it very easy to scale up and down your deployments, through either command line or web console.  Let's first check what pods are running the batch application:

oc get pod -l app=numbers-chunk-thorntail


NAME                         READYSTATUSRESTARTS   AGE
numbers-chunk-thorntail-1-nqnjj   1/1  Running   0     2d


To view the application runtimne log in an text editor:

oc logs numbers-chunk-thorntail-1-nqnjj | view -


From the above log output, you can see that the application has been successfully built and deployed to OpenShift online, and the batch job has been started and completed.  As you can see, there is only 1 pod running this batch application.  To scale it up to 3 pods to service heavy load, and check the number of pods:


oc scale --replicas=3 dc numbers-chunk-thorntail
deploymentconfig.apps.openshift.io "numbers-chunk-thorntail" scaled

oc get pod -l app=numbers-chunk-thorntail


NAME                          READY STATUSRESTARTS   AGE
numbers-chunk-thorntail-1-knxp7   1/1   Running   0      29s
numbers-chunk-thorntail-1-nqnjj   1/1   Running   0      2d
numbers-chunk-thorntail-1-vlcpt   1/1   Running   0      29s


Among the 3 pods listed above, we can see that 2 are newly started, along with the one that has been running for a while.  Now let's check how to scale it back.  Say, we want to scale it back to 2 if the current replica count is 3:


oc scale --current-replicas=3 --replicas=2 dc numbers-chunk-thorntail
deploymentconfig.apps.openshift.io "numbers-chunk-thorntail" scaled

oc get pod -l app=numbers-chunk-thorntail


NAME                          READY STATUSRESTARTS   AGE
numbers-chunk-thorntail-1-knxp7   1/1   Running   0      11m
numbers-chunk-thorntail-1-nqnjj   1/1   Running   0      2d


Access Thorntail-based Batch Application on OpenShift through REST API


Once the application is deployed to OpenShift, you can invokes its REST API to perform various batch processing operations. The steps are the same for both local Thorntail or OpenShift Thorntail runtime.


# to start the job named `numbers`
curl -s -X POST -H 'Content-Type:application/json' "http://numbers-chunk-thorntail-pr.xxxx.xxxx.openshiftapps.com/api/jobs/numbers/start" | jq

# to get the details and status of the newly started job execution
curl -s "http://numbers-chunk-thorntail-pr.xxxx.xxxx.openshiftapps.com/api/jobexecutions/1" | jq

# to get all step executions belonging to this job execution
curl -s "http://numbers-chunk-thorntail-pr.xxxx.xxxx.openshiftapps.com/api/jobexecutions/1/stepexecutions" | jq

# to abandon the above job execution
curl -X POST -H 'Content-Type:application/json' "http://numbers-chunk-thorntail-pr.xxxx.xxxx.openshiftapps.com/api/jobexecutions/1/abandon"

# to schedule a job execution with initial delay of 1 minute and repeating with 60-minute interval
curl -s -X POST -H 'Content-Type:application/json' -d '{"jobName":"numbers", "initialDelay":1, "interval":60}' "http://numbers-chunk-thorntail-pr.xxxx.xxxx.openshiftapps.com/api/jobs/numbers/schedule" | jq

# to list all job schedules
curl -s "http://numbers-chunk-thorntail-pr.xxxx.xxxx.openshiftapps.com/api/schedules" | jq

# to cancel a job schedule
curl -s -X POST -H 'Content-Type:application/json' "http://numbers-chunk-thorntail-pr.xxxx.xxxx.openshiftapps.com/api/schedules/1/cancel" | jq

# to get details of a job schedule
curl -s "http://numbers-chunk-thorntail-pr.xxxx.xxxx.openshiftapps.com/api/schedules/2" | jq


Summary


We've just finished developing, deploying and running a batch processing microservices application based on Thorntail, in both local environment and OpenShift Online.  The combined power of Thorntail MicroProfile and OpenShift has opened up many possibilities for developing and managing batch processing applications.  I hope you find the information presented here useful, and as always, feedback and comments are much appreciated.

Introduction


When migrating Java batch applications to cloud platforms such as OpenShift, there are different approaches how to build and containerize traditional applications.  Recall that JSR-352-based Java batch applications can be developed and run in either Java SE or Java EE (now Jakarta EE) environment.  So if your existing Java batch applications are Java EE web or enterprise applications deployed to application servers like WildFly, then you would build the new cloud batch applications based on OpenShift WildFly image streams and run it WildFly runtime on OpenShift.


If you've chosen to develop and run your existing Java batch applications as light-weight standalone Java SE applications, it's also easy to migrate to OpenShift using openjdk image steams and runtime.  This is what we will be exploring in this blog post to help JBeret users better understand the concepts and steps it takes to modernize batch applications.  OpenShift provides a Java S2I (source-to-image) builder process that handles everything from building application source code, injecting application to the base image, publishing to OpenShift image registry, and readying the application for execution.  A JBeret sample batch application, jberet-simple, will be used to illustrate each step.


Set up, Build and Run Sample Batch Application the Traditional Way


First, let's see how to build and run the sample application the traditionaly way locally, and familiarize ourselves with the application structure and batch job.  jberet-simple is a simple standalone Java SE batch processing application and contains a single batch job as defined in simple.xml.  This batch job contains a single chunk-type step that reads a list of numbers by chunks and prints them to the console. The 2 batch artifacts used in this application are:


For complete batch job definition, see the JSL file simple.xml.


To git-clone the sample application from github:

git clone https://github.com/jberet/jberet-simple.git


To build the sample application with Maven, including running the integration test:

mvn clean install


To run the integration test that starts the batch job:

mvn integration-test


To run application main class with maven exec plugin, execute any of the following mvn commands:


# run with the default configuration in pom.xml
mvn exec:java

# run with job xml
mvn exec:java -Dexec.arguments="simplxe.xml"

# run with job xml and job parameters
mvn exec:java -Dexec.arguments="simple.xml jobParam1=x jobParam2=y jobParam3=z"


To build  the application as an executable uber jar (fat jar) and run it directly with java -jar command:


mvn clean install -Popenshift
java -jar target/jberet-simple.jar simple.xml jobParam1=x jobParam2=y


Note that in the above command, a maven profile named openshift is used.  This profile tells maven to build the uber jar to include everything needed to run the application.  When openshift profile is present, it will be picked up by OpenShift S2I builder process instead of the default profile.  Of course, this profie can also be invoked manually as we just did above.


Build Application Images and Deploy to OpenShift


Next, let's delve into how to run jberet-simple application on OpenShift.  Since this is a standalone Java SE application, OpenShift will need to enlist a Java SE runtime, and here we choose to use openjdk18.  All the operations we will be performing can be done via either OpenShift command line tool (oc), or OpenShift Web Console.  For the sake of brevity, we will use oc commands.  For introduction to various features in OpenShift, you may want to check out OpenShift interactive tutorials.


We assume you already have an OpenShift account, and to log in:

oc login https:xxx.openshift.com --token=xxx


To create a new project, if there is no existing projects:

oc new-project 


We wil use openjdk18-openshift image stream. Check if it is available in the current project:

oc get is


If openjdk18-openshift is not present, import it:

oc import-image my-redhat-openjdk-18/openjdk18-openshift --from=registry.access.redhat.com/redhat-openjdk-18/openjdk18-openshift --confirm


to create a new application (with default name):

oc new-app openjdk18-openshift~https://github.com/jberet/jberet-simple.git


Or to create a new application with custom name, if the default name doesn't fit:

oc new-app openjdk18-openshift~https://github.com/jberet/jberet-simple.git --name=hello-batch


The above new-app command takes a while to complete.  To check its status:

oc status


To list pods, and get logs for the pod associated with the application (replace jberet-simple-1-kpvqn with your pod name):

oc get pods
oc logs jberet-simple-1-kpvqn


From the above log output, you can see that the application has been successfully built, deployed to OpenShift online, and batch job executed.


Launch a Job Execution from OpenShift Command Line


By now we've successfully built, deployed to OpenShift and started the batch job execution.  You want want to run it again later as needed, and this can be easily done with OpenShift command line with oc client tool and Kubernetes job api.


First, create a yaml file to describe how OpenShift should run the batch application.  For example, I created the following file, simple.yaml, to launch the batch application (replace container image value to the appropriate one in your OpenShift environment):


apiVersion: batch/v1
kind: Job
metadata:
  name: simple
spec:
  parallelism: 1
  completions: 1
  template:
    metadata:
      name: simple
    spec:
      containers:
      - name: jberet-simple
        image: docker-registry.default.svc:5000/pr/jberet-simple
        command: ["java",  "-jar", "/deployments/jberet-simple.jar", "simple.xml", "jobParam1=x", "jobParam2=y"]
      restartPolicy: OnFailure


Then, run the following command to tell OpenShift to launch the job execution:


$ oc create -f simple.yaml
job.batch "simple" created


To list Kubernetes jobs:


$ oc get jobs
NAME      DESIRED   SUCCESSFUL   AGE
simple    1         1            12m


To list pods, including the one responsible for running the above simple batch application:


$ oc get pods
NAME                    READY     STATUS             RESTARTS   AGE
jberet-simple-5-build   0/1       Completed          0          11h
jberet-simple-6-build   0/1       Completed          0          8h
jberet-simple-6-wwjm7   0/1       CrashLoopBackOff   105        8h
postgresql-5-sbfm5      1/1       Running            0          1d
simple-mpq8h            0/1       Completed          0          8h


To view logs from the above simple batch job execution, passing the appropriate pod name:


$ oc logs simple-mpq8h


To delete the job created in above step:


$ oc delete job simple
job.batch "simple" deleted


Schedule Repeating Job Executions with Kubernetes Cron Jobs from OpenShift Command Line


You may be wondering if it's possible to schedule periodic batch job executions from OpenShift command line.  The answer is yes, and this is supported with Kubernetes cron job api, similar to launching one-time job execution as demonstrated above.


First, create a yaml file to define the Kubernetes crob job spec.  In the following example, simple-cron.yaml, the cron expression `*/1 * * * *` specifies running the batch job every minute.


apiVersion: batch/v1beta1
kind: CronJob
metadata:
  name: simple-cron
spec:
  successfulJobsHistoryLimit: 3
  failedJobsHistoryLimit: 1
  schedule: "*/1 * * * *"
  jobTemplate:
    spec:
      template:
        spec:
          containers:
          - name: simple-cron
            image: docker-registry.default.svc:5000/pr/jberet-simple
            command: ["java",  "-jar", "/deployments/jberet-simple.jar", "simple.xml", "jobParam1=x", "jobParam2=y"]
          restartPolicy: OnFailure


Then, run the following commands to tell OpenShift to schedule the job executions:


$ oc create -f simple-cron.yaml
cronjob.batch "simple-cron" created


To list all cron jobs:


$ oc get cronjobs
NAME          SCHEDULE      SUSPEND   ACTIVE    LAST SCHEDULE   AGE
simple-cron   */1 * * * *   False     0                   7s


To get status of a specific cron job:


$ oc get cronjob simple-cron
NAME          SCHEDULE      SUSPEND   ACTIVE    LAST SCHEDULE   AGE
simple-cron   */1 * * * *   False     0                   24s


To get continuous status of a specific cron job with --watch option:


$ oc get cronjob simple-cron --watch
NAME          SCHEDULE      SUSPEND   ACTIVE    LAST SCHEDULE   AGE
simple-cron   */1 * * * *   False     0                   33s
simple-cron   */1 * * * *   False     1         7s        46s
simple-cron   */1 * * * *   False     0         37s       1m


To get all pods, including the pods responsible for running scheduled job executions:


$ oc get pods
NAME                           READY     STATUS              RESTARTS   AGE
postgresql-5-sbfm5             1/1       Running             0          27d
simple-cron-1536609780-fmrhf   0/1       ContainerCreating   0          1s
simple-mpq8h                   0/1       Completed           0          26d


To view logs of one of the scheduled job executions, passing the appropriate pod name:


$ oc logs simple-cron-1536609780-fmrhf


To delete the cron job created above:


$ oc delete cronjob simple-cron
cronjob.batch "simple-cron" deleted


Summary


In this blog post, we demonstrated with a sample Java batch application how to run it locally, build and deploy containerized application to OpenShift, launch batch job execution from OpenShift command line, and schedule cron jobs of periodic batch job executions.  This post just touches some of the basics of running batch jobs in OpenShift platform, and there are many options for concurrency, scalability and restartability that are worth exploring further.  I hope you find it useful in your batch applicaton development, and feedback and comments are always welcome to help us improve project JBeret.

Red Hat Developer Studio is a comprehensive IDE for developing a wide range of enterprise applications, including Java applications for batch processing.  In this post, I will write about how to develop a standard-based batch application in Red Hat Developer Studio, using various JBeret libraries, and deployed to WildFly application server.


Import Sample Application


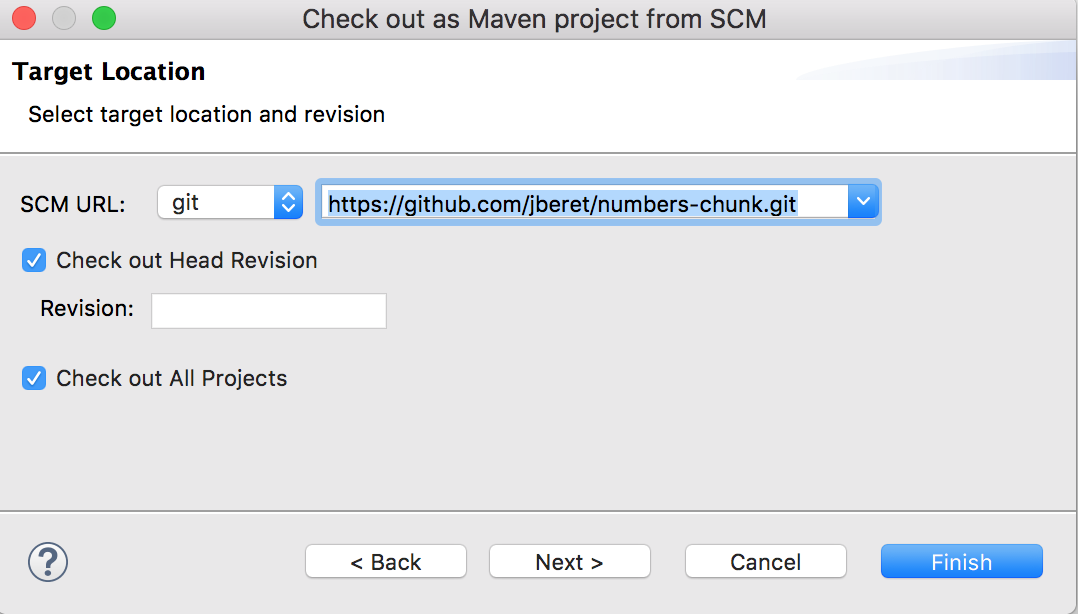
We will be using an existing batch sample application, numbers-chunk, as the base project to save us the initial setup work.  First, we need to import it into the  studio with the Eclipse project import wizard (File > Import, and then choose Maven > Check out Maven Projects from SCM, and then enter its git repo URL: https://github.com/jberet/numbers-chunk.git).


Now we have a fully functional Java EE batch application imported into the studio, which can be deployed and run in WildFly, or enhanced to add more jobs and processing steps. There is an existing job XML file, numbers.xml, which contains a chunk-type step reading an array of numbers and writing them out to the console.  We will define a new job similar to this and also adding an item processor to the step.


Implement Item Processor Class


Create a new folder named "java" under src/main, if it does not already exist (File > New > Folder).


Create the java package structure, org.jberet.samples.wildfly.numberschunk, under src/main/java directory.


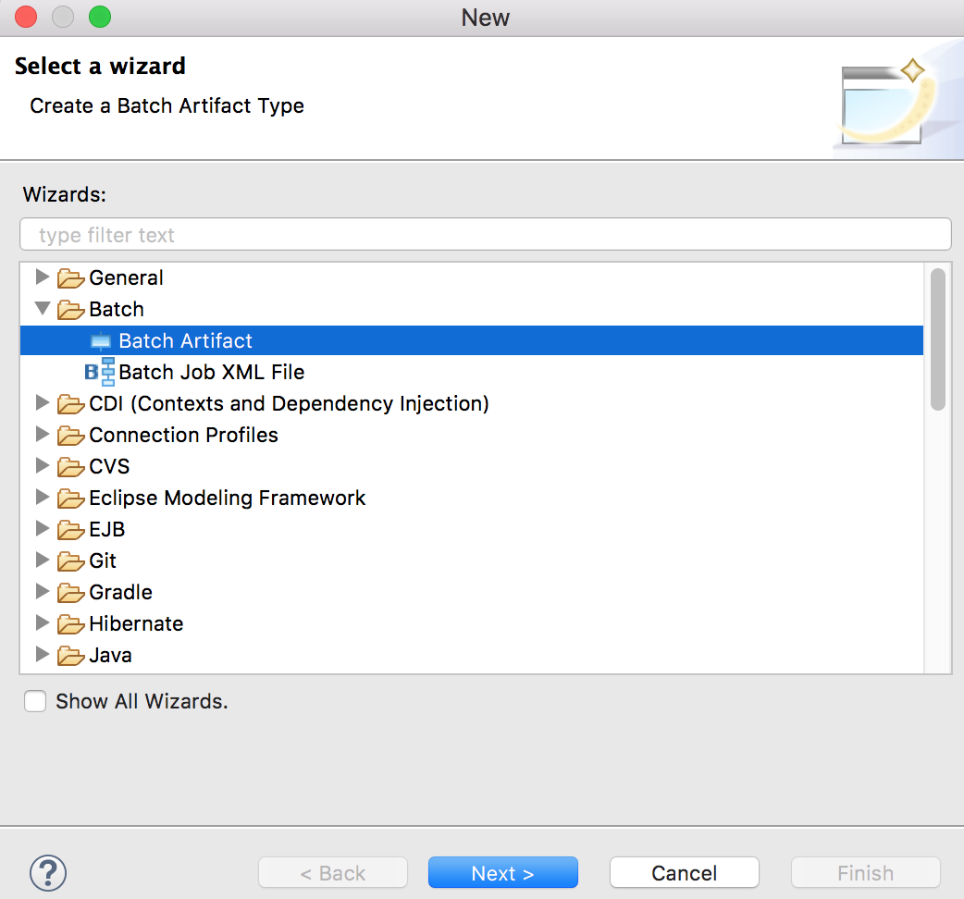
Create the item processor class by following the command sequence File > New > Other (or Command + N, or Ctrl + N) to bring up the wizard:


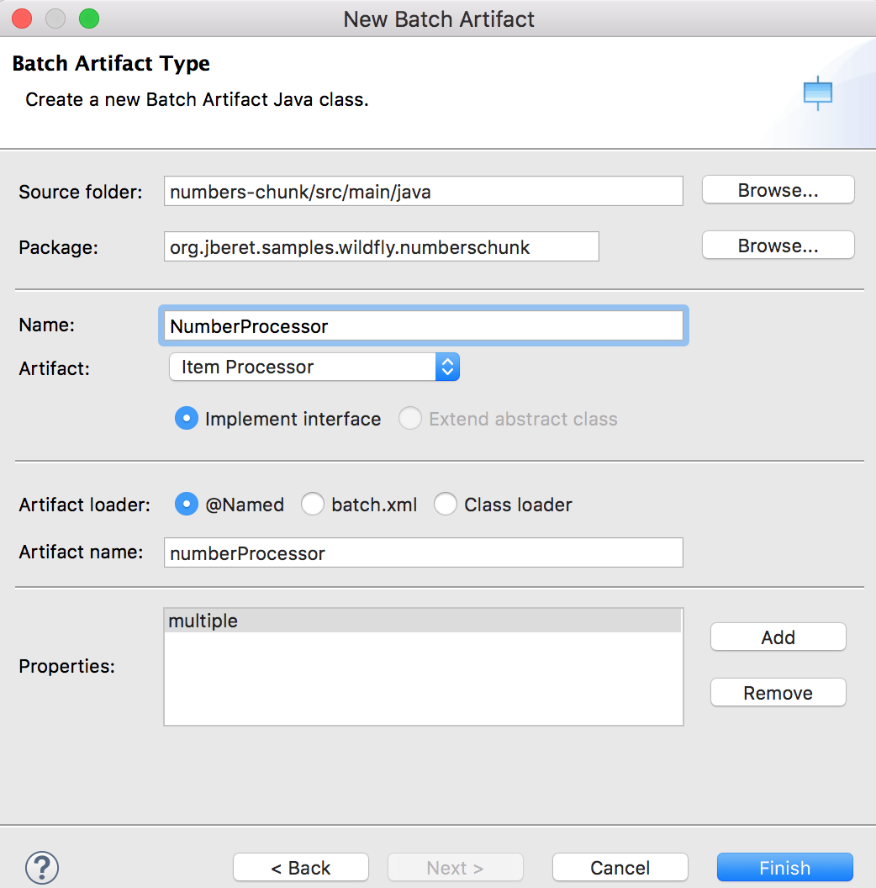
In the above wizard, specify the item processor class name: NumberProcessor, and add a property named multiple.  After clicking Finish, a skeleton class is generated.  And we just need to change the body of its processItem method to multiply the item number by the multiple property:


package org.jberet.samples.wildfly.numberschunk;

import javax.batch.api.BatchProperty;
import javax.batch.api.chunk.ItemProcessor;
import javax.inject.Inject;
import javax.inject.Named;

@Named
public class NumberProcessor implements ItemProcessor {

    @Inject
    @BatchProperty
    protected int multiple;

    @Override
    public Object processItem(Object item) throws Exception {
        return ((Integer) item) * multiple;
    }
}


Using the above batch artifact wizard, you can create all types of batch artifacts:

  1. Batchlet
  2. Decider
  3. Item Reader
  4. Item Writer
  5. Item Processor
  6. Checkpoint Algorithm
  7. Partition Mapper
  8. Partition Reducer
  9. Partition Collector
  10. Partition Analyzer
  11. Job Listener
  12. Step Listener
  13. Chunk Listener
  14. Item Reader Listener
  15. Item Process Listener
  16. Item Write Listener
  17. Skip Read Listener
  18. Skip Process Listener
  19. Skip Write Listener
  20. Retry Read Listener
  21. Retry Process Listener
  22. Retry Write Listener


Design Batch Job XML


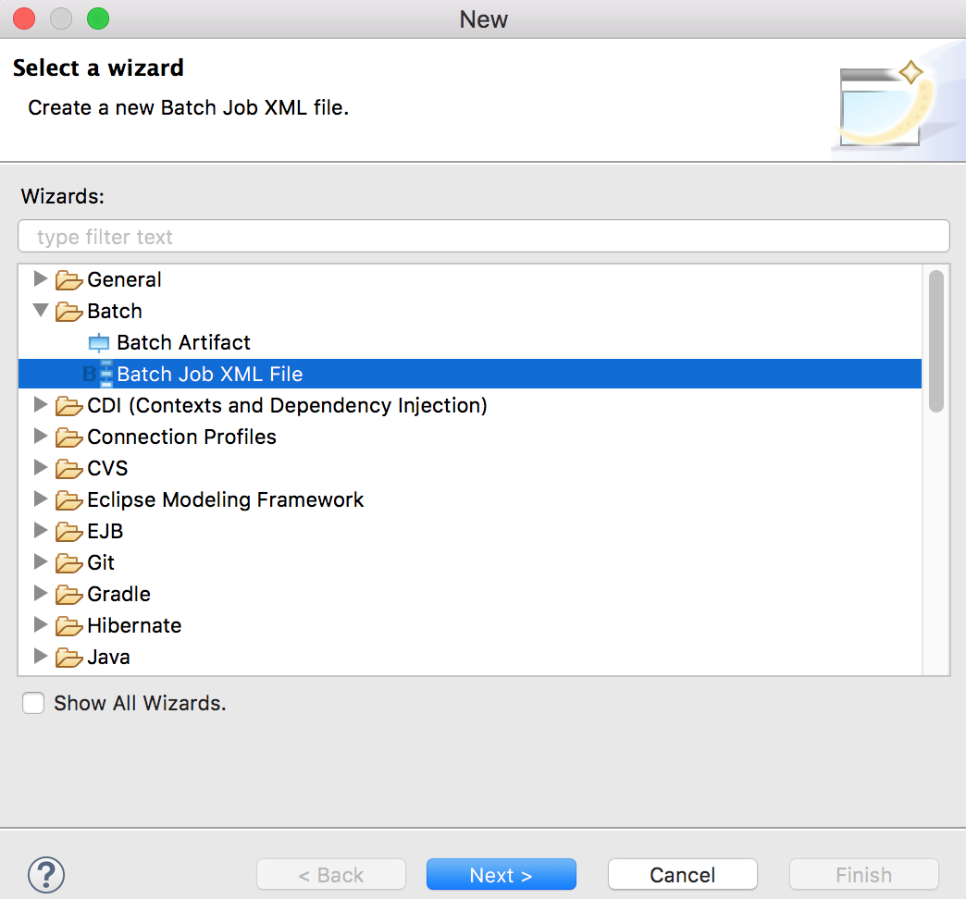
Next, let's see how the studio makes it easy to design batch job flows.  Choose menu File > New > Other (Command + N or Ctrl + N) to start the batch job XML wizard:


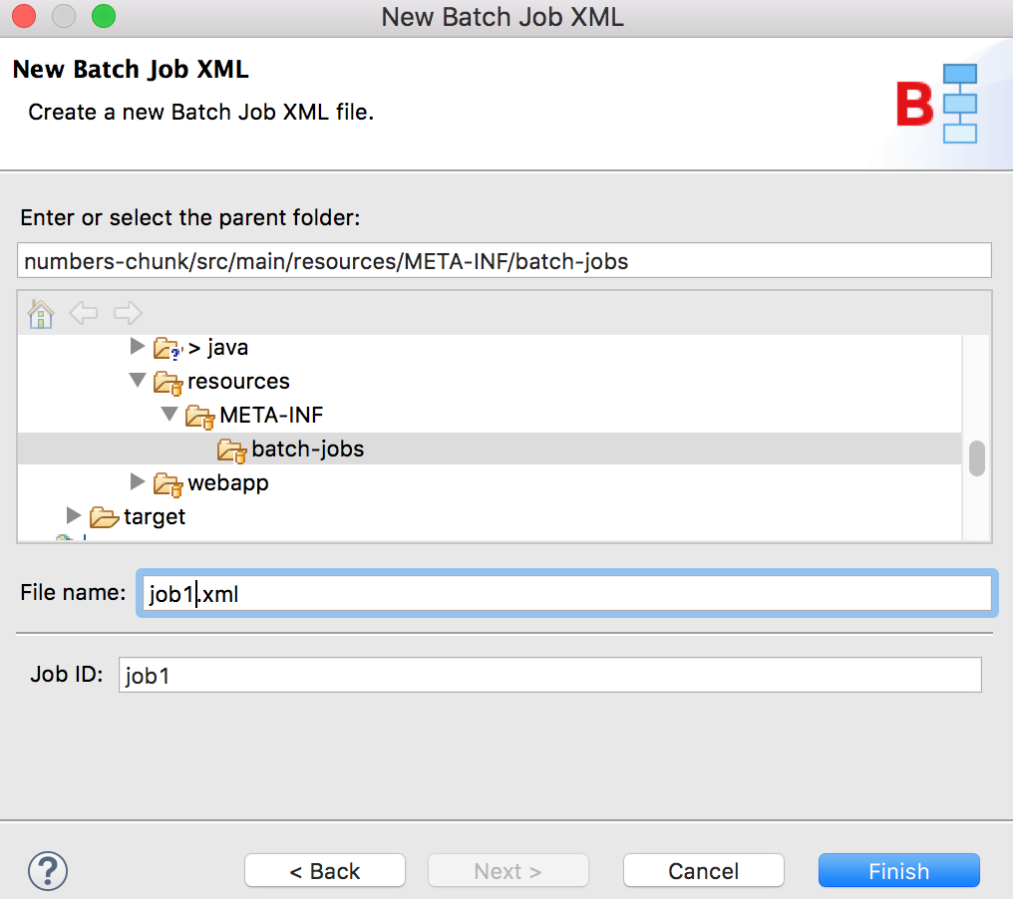
In the next screen, enter the file name for the job XML: job1.xml.  Notice that the job id field is automatically updated to the same value without the .xml extension.


Define and Configure Step


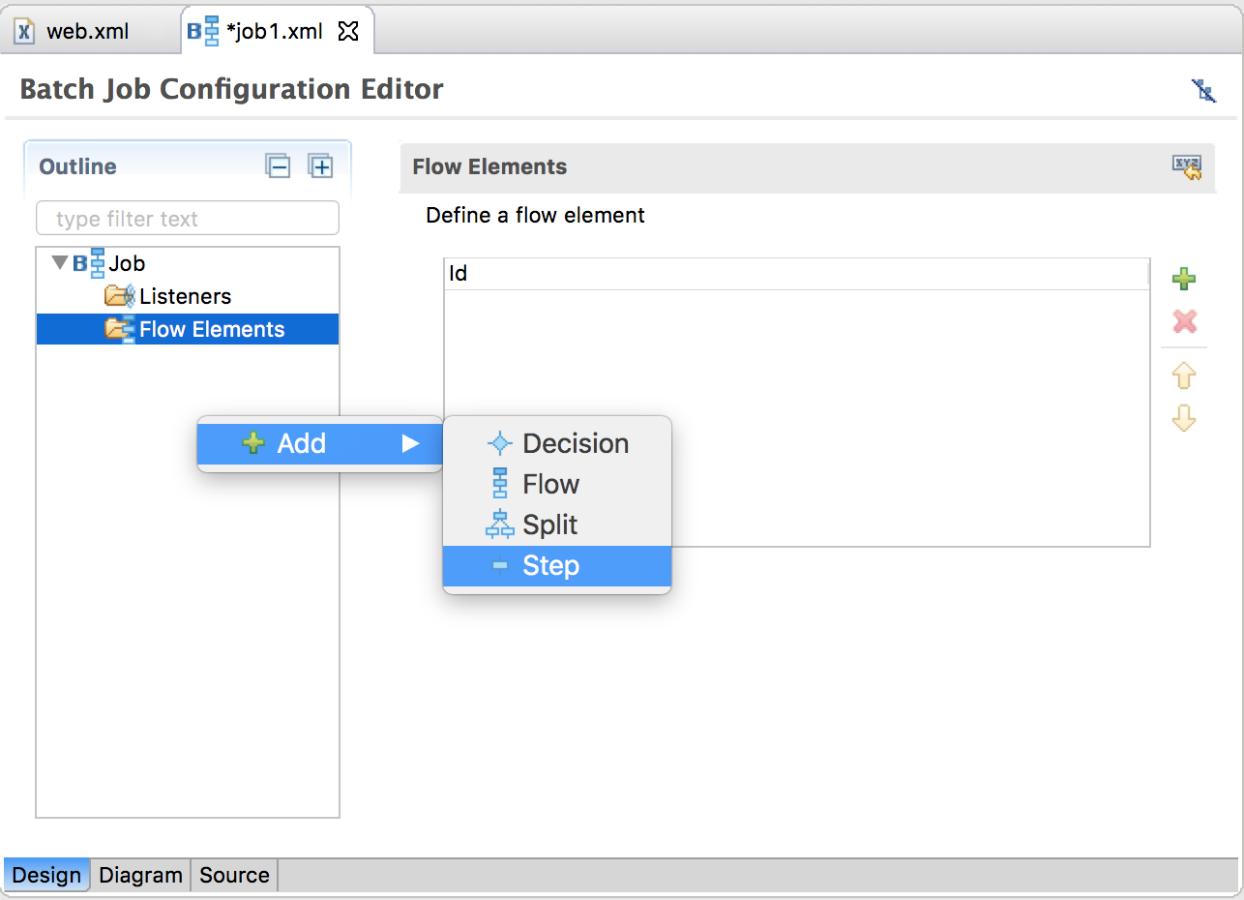
After clicking Finish, the job XML skeleton is generated at the correct location, numbers-chunk/src/main/resources/META-INF/batch-jobs.  In the studio editor, the job XML is displayed in 3 views: Design, Diagram and Source.  You can modify the job definition in any of the 3 views and all changes will be synchronized.  Next, let's add a step, step1, to the job in the Design view:


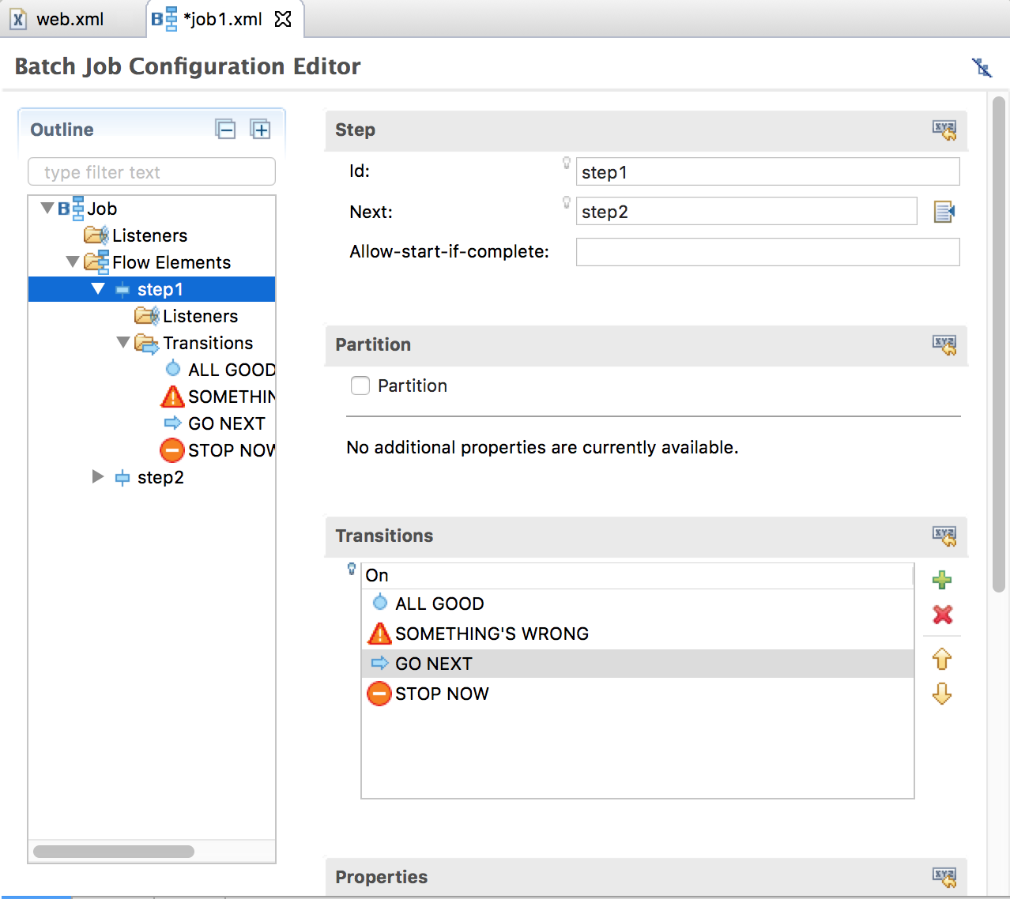
In the step details panel, add step configuration information, including id and next attribute, transition elements (fail, end, stop and next) and step properties.  Note that only one of next attribute or next transition element can be specified for transition, but not both.  You can enter the name and value for any number of step properties in this page.


Configure Chunk


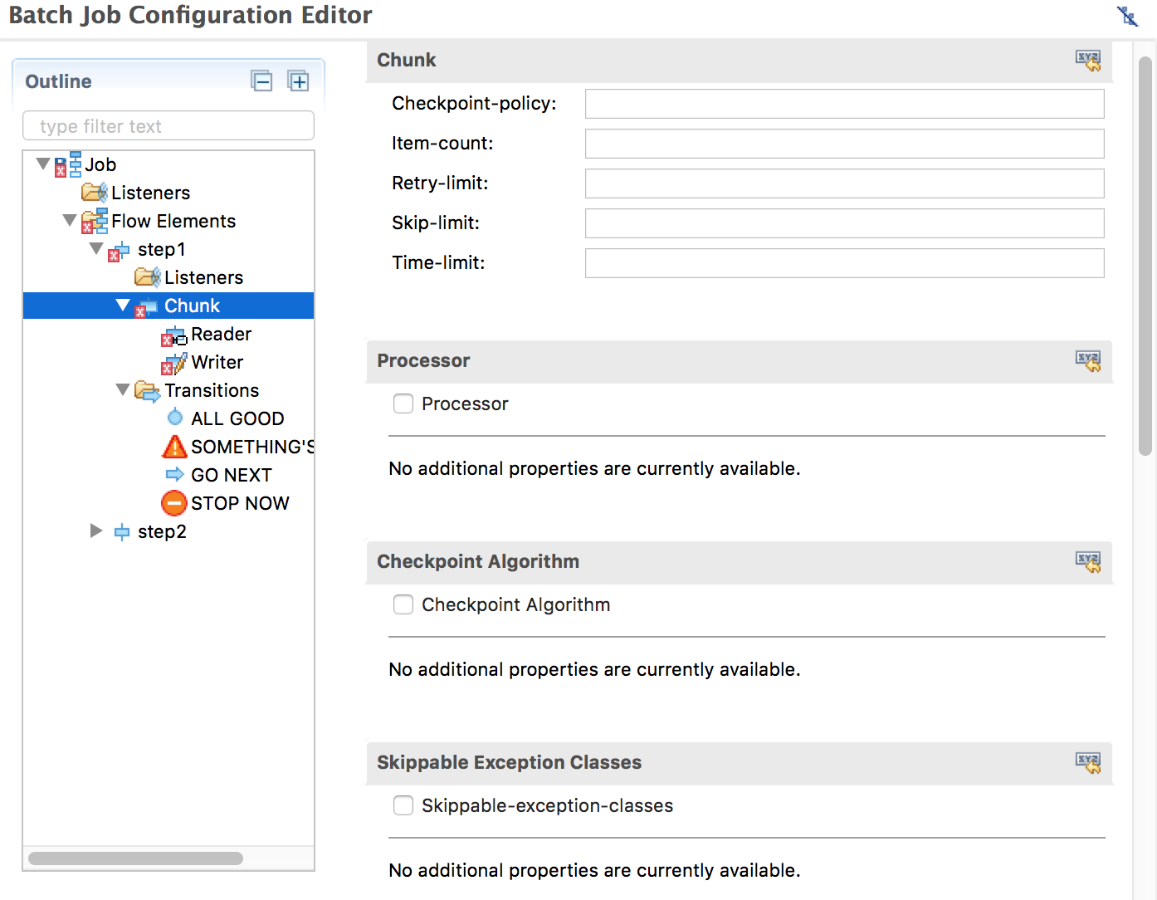
Since we want step1 to be a chunk step, we need to add a chunk element to step1.  Right-click step1 on the left panel, and choose Add > Chunk in the context menu, and fill chunk attributes on the right panel.  These are all optional configurations and their default values should suffice in many cases.


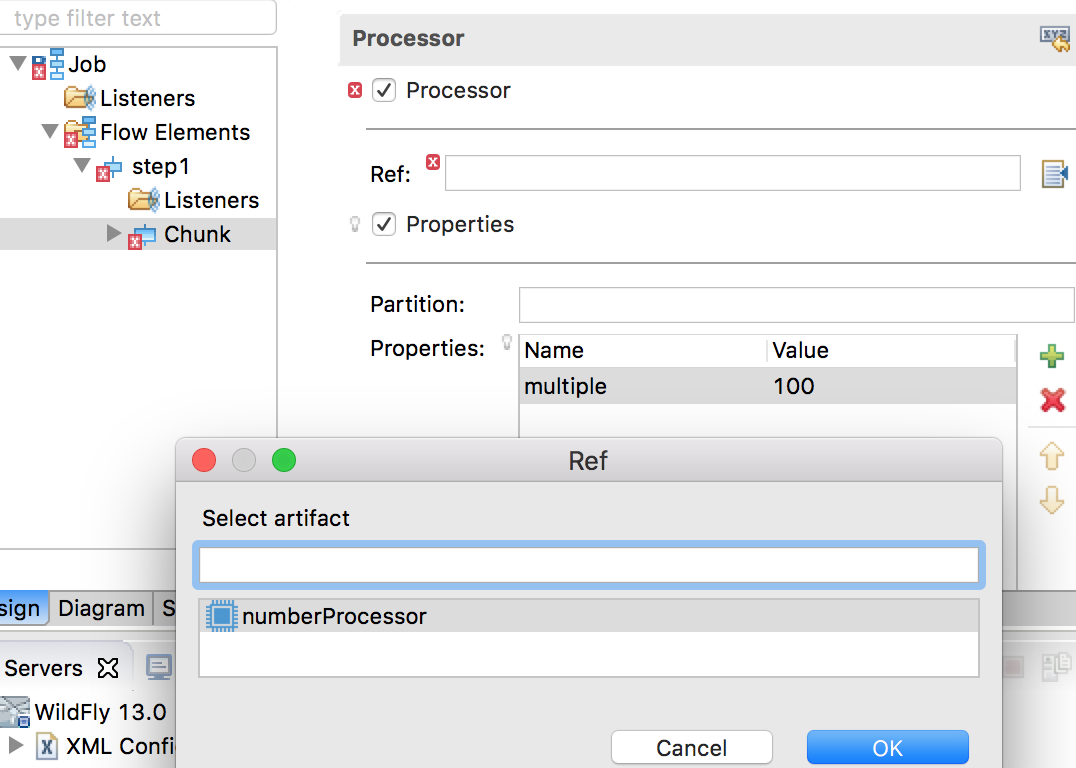
We will use the NumberProcess class we created earlier as the item processor.  The Processor Ref field supports code-completion: press Ctrl-Space while the focus is in this field to display all item processors available in the application.  Alternatively, you can click the browse button to the right of the input field to select artifact from all available choices.


Configure Item Reader and Writer


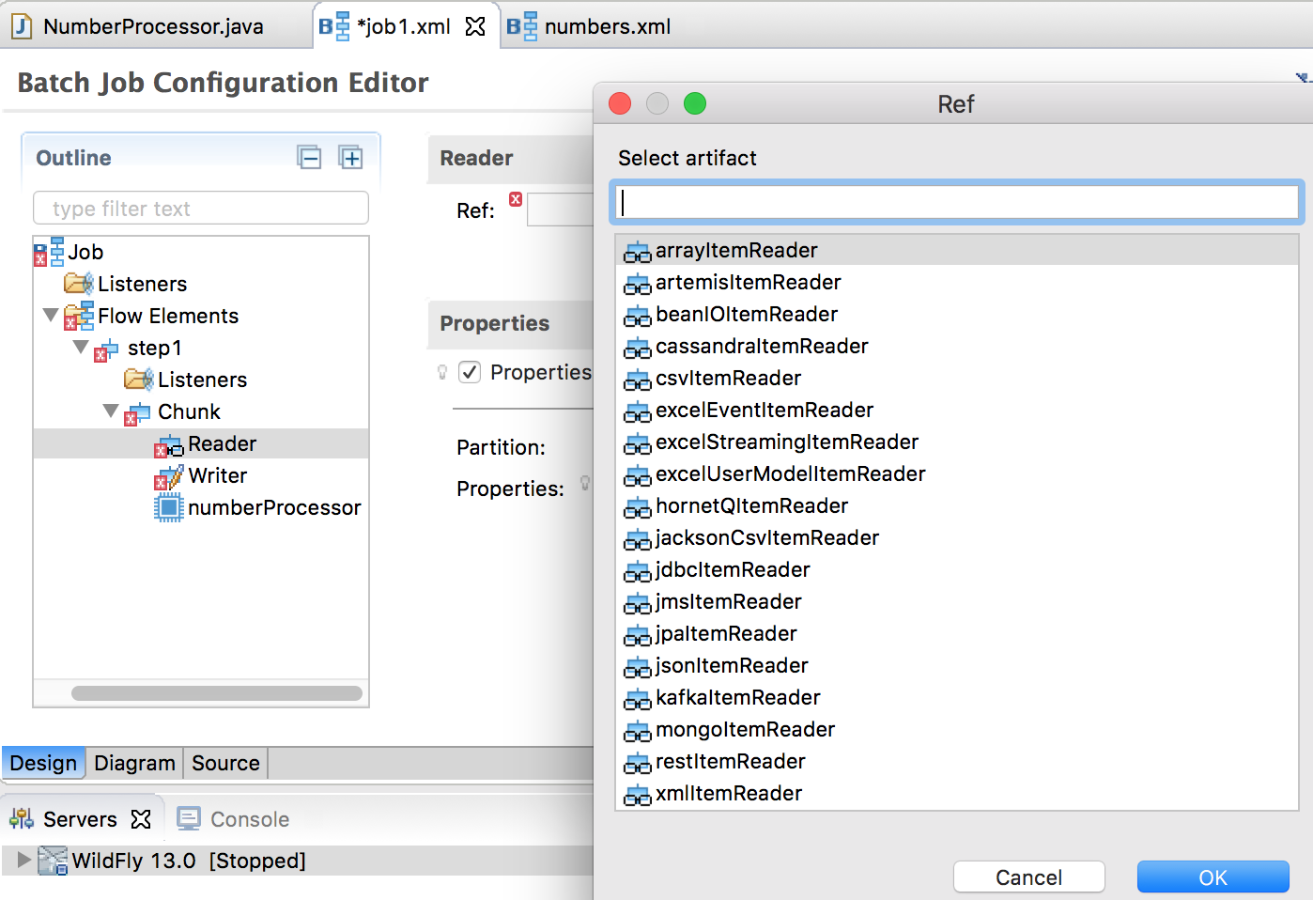
A chunk-type step is required to contain an item reader and writer.  Expand the Chunk node in the left panel, you will see reader, writer and processor subelements.  Click Reader element and you will be able to configure the reader in the right panel.  Choose arrayItemReader as the reader ref among all available readers, which come from jberet-support library configured as project dependency.


Specify 2 properties for arrayItemReader:

  • resource: [0, 1, 2, 3, 4, 5, 6, 7, 8, 9, 10, 11, 12, 13, 14, 15]
  • beanType: java.lang.Integer


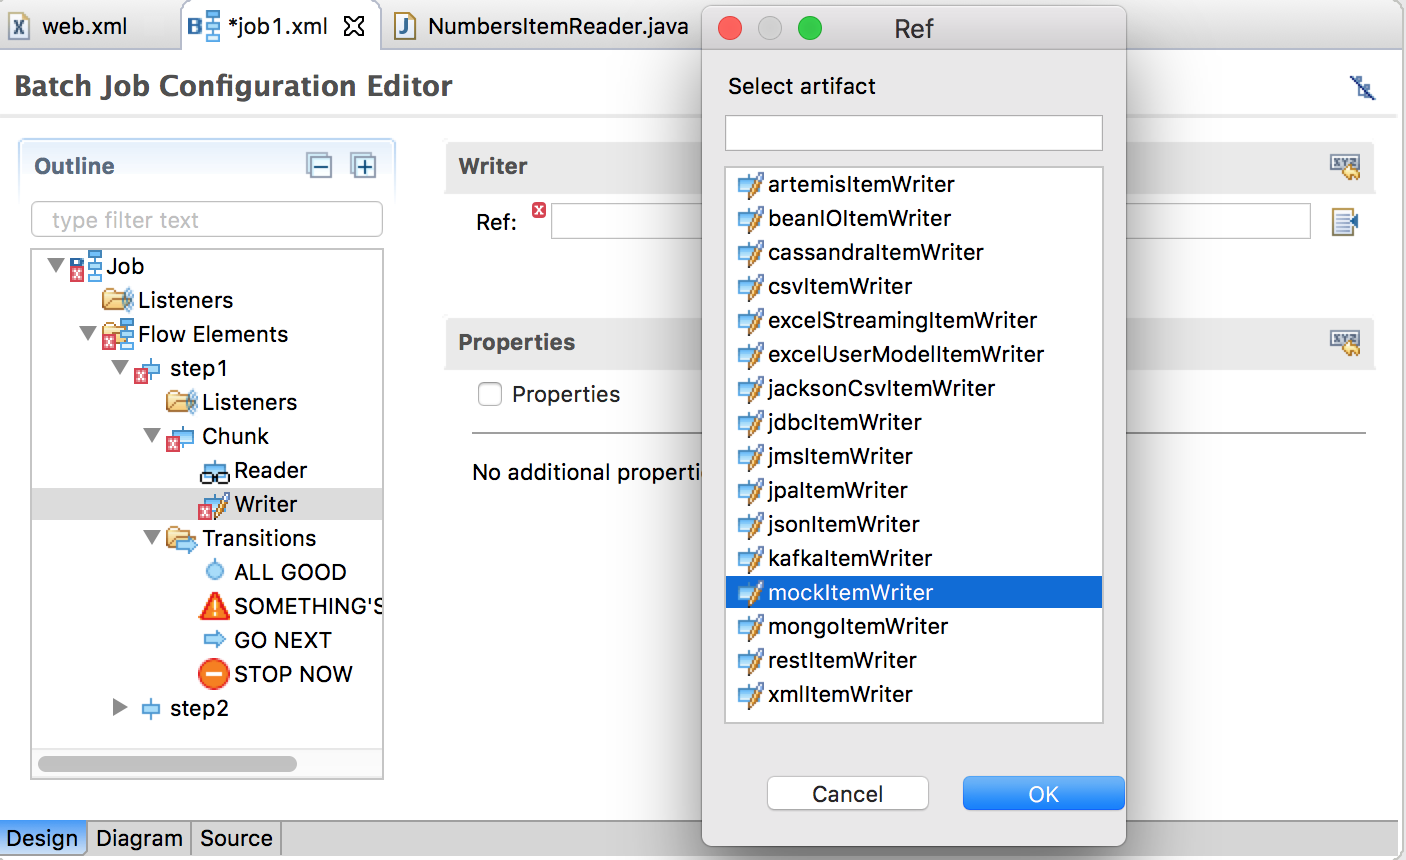
Item writer can be configured similarly by choosing mockItemWriter from all available writers.


Build, Publish and Run Batch Application


After saving the project, we are ready to build the application.  If Project > Build Automatically is checked, then the project has already been built; otherwise, choose Project > Build.


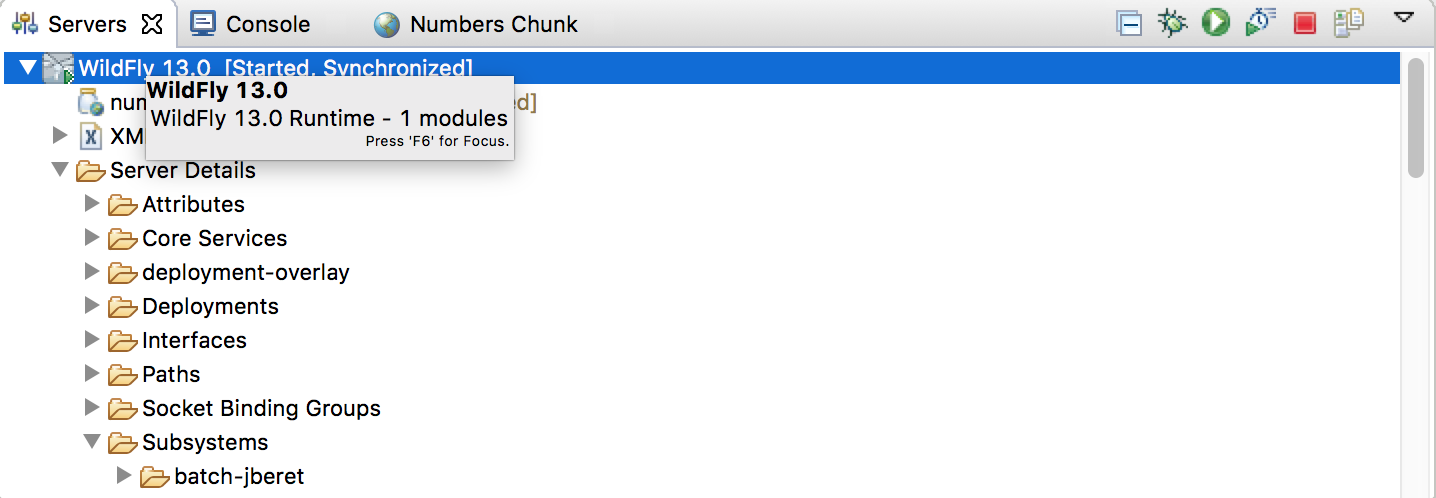
To start WildFly from within the studio, go to Servers view, right-click WildFly element and choose Start from the context menu.

To publish numbers-chunk application to WildFly, select numbers-chunk project in Project Explorer, then choose  menu Run > Run As > Run on Server.  After the application is successfully published onto WildFly, the studio will display the application welcome page:


Perform Batch Processing Operations


Now that our batch application is up and running, we are ready to perform some common batch processing tasks via REST calls.  You can issue curl commands in a terminal, or use other REST client tools.  To keep it simple, we will use curl commands to send REST requests and python to pretty-print JSON output.


To start job numbers.xml (the existing job from github remote repo):


curl -s -X POST -H 'Content-Type:application/json' http://localhost:8080/numbers-chunk/api/jobs/numbers/start | python -m json.tool
{
    "batchStatus": "STARTING",
    "createTime": 1534112744022,
    "endTime": null,
    "executionId": 1,
    "exitStatus": null,
    "href": "http://localhost:8080/numbers-chunk/api/jobexecutions/1",
    "jobInstanceId": 1,
    "jobName": "numbers",
    "jobParameters": null,
    "lastUpdatedTime": 1534112744022,
    "startTime": null
}


To start job job1.xml (the new job we just created).  In the studio console window, notice that all numbers have been multiplied by 100 by the item processor.


curl -s -X POST -H 'Content-Type:application/json' http://localhost:8080/numbers-chunk/api/jobs/job1/start | python -m json.tool
{
    "batchStatus": "STARTING",
    "createTime": 1534114529790,
    "endTime": null,
    "executionId": 2,
    "exitStatus": null,
    "href": "http://localhost:8080/numbers-chunk/api/jobexecutions/2",
    "jobInstanceId": 2,
    "jobName": "job1",
    "jobParameters": null,
    "lastUpdatedTime": 1534114529790,
    "startTime": null
}


To check the status of job execution we just started above:


curl -s http://localhost:8080/numbers-chunk/api/jobexecutions/2 | python -m json.tool
{
    "batchStatus": "COMPLETED",
    "createTime": 1534114529790,
    "endTime": 1534114529837,
    "executionId": 2,
    "exitStatus": "COMPLETED",
    "href": "http://localhost:8080/numbers-chunk/api/jobexecutions/2",
    "jobInstanceId": 2,
    "jobName": "job1",
    "jobParameters": null,
    "lastUpdatedTime": 1534114529837,
    "startTime": 1534114529807
}


To show step execution details of a job execution:


curl -s http://localhost:8080/numbers-chunk/api/jobexecutions/1/stepexecutions | python -m json.tool
[
    {
        "batchStatus": "COMPLETED",
        "endTime": 1534112744112,
        "exitStatus": "COMPLETED",
        "metrics": [
            {
                "type": "FILTER_COUNT",
                "value": 0
            },
            {
                "type": "ROLLBACK_COUNT",
                "value": 0
            },
            {
                "type": "PROCESS_SKIP_COUNT",
                "value": 0
            },
            {
                "type": "READ_COUNT",
                "value": 16
            },
            {
                "type": "WRITE_COUNT",
                "value": 16
            },
            {
                "type": "WRITE_SKIP_COUNT",
                "value": 0
            },
            {
                "type": "READ_SKIP_COUNT",
                "value": 0
            },
            {
                "type": "COMMIT_COUNT",
                "value": 2
            }
        ],
        "startTime": 1534112744046,
        "stepExecutionId": 1,
        "stepName": "simple.step1"
    }
]


To schedule a job for later or repeated execution (the following command starts running job1 after 1 minute, and in every 60 minutes afterwards):


curl -s -X POST -H 'Content-Type:application/json' -d '{"jobName":"job1", "initialDelay":1, "interval":60}' http://localhost:8080/numbers-chunk/api/jobs/job1/schedule | python -m json.tool
{
    "createTime": 1534130379291,
    "id": "2",
    "jobExecutionIds": [],
    "jobScheduleConfig": {
        "afterDelay": 0,
        "initialDelay": 1,
        "interval": 60,
        "jobExecutionId": 0,
        "jobName": "job1",
        "jobParameters": null,
        "persistent": false,
        "scheduleExpression": null
    },
    "status": "SCHEDULED"
}


To cancel the above schedule:


curl -s -X POST -H 'Content-Type:application/json' http://localhost:8080/numbers-chunk/api/schedules/1/cancel | python -m json.tool


Summary


In this post, we've explored various features in Red Hat Developer Studio in developing batch application, including using wizards for generating batch artifacts, visually designing batch job work flow, instant synchronization between job XML design view, diagram and source view, batch artifact ref name suggestions and completion, etc.  I hope these features will help you further improve productivity in developing batch applications.

WildFly 13 (released in May 2018) includes a major upgrade to its admin console, with improved UI representation and added functionality. In this post, I will show how this upgrade has benefited JBeret batch subsystem, and how batch application developers perform common tasks in WildFly 13 admin console.


Configure Batch Subsystem


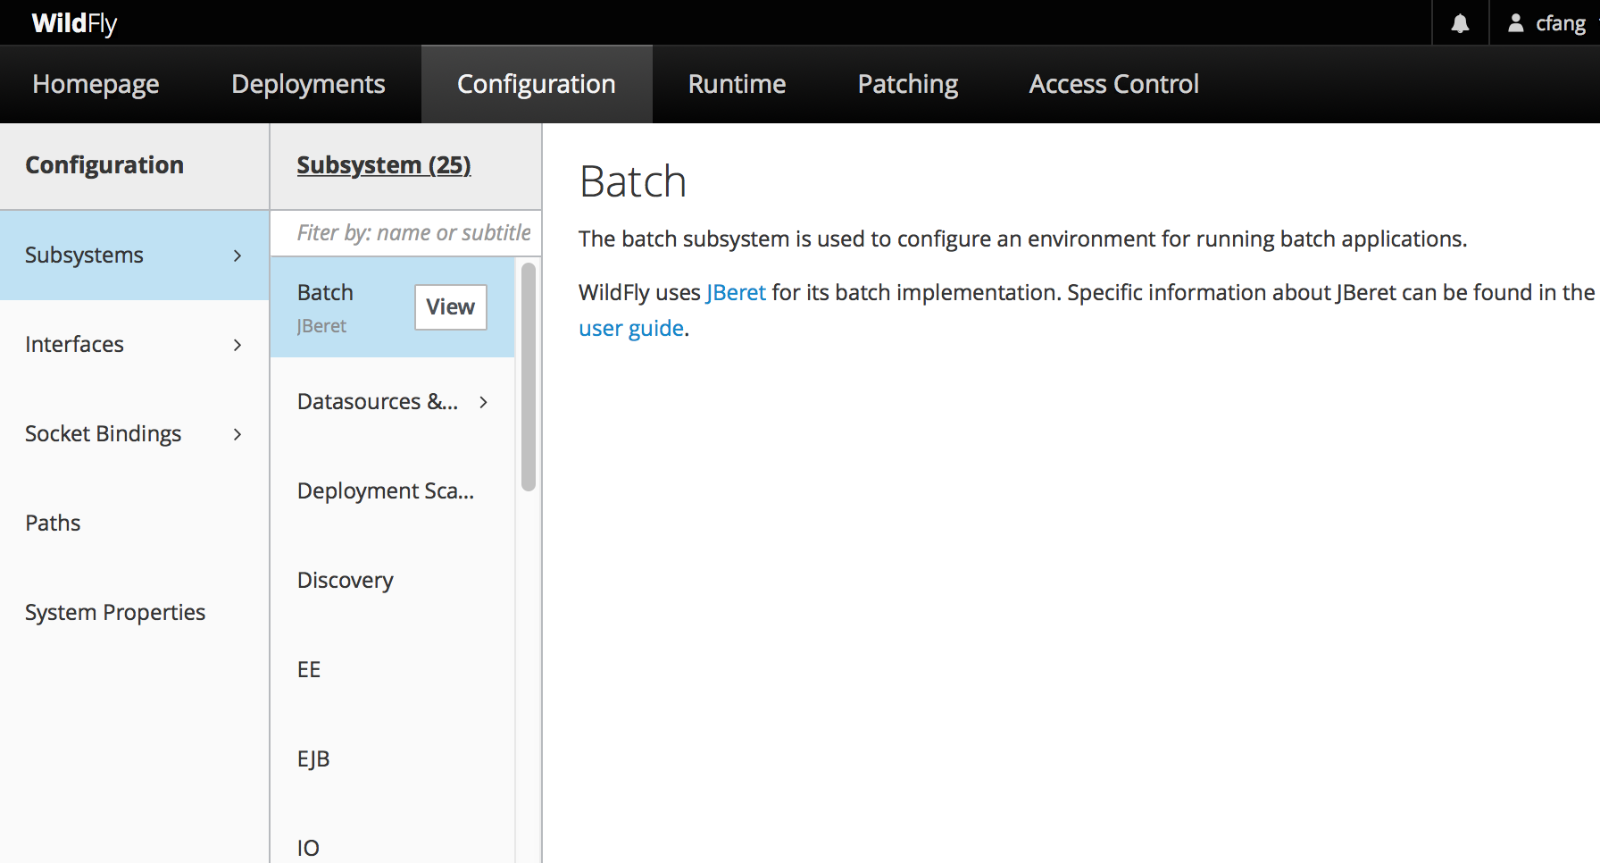
To configure batch subsystem, click the Configuration tab on the top of the page, and then choose Batch JBeret subsystem. If you need to access batch subsystem frequently, you may want to pin it by clicking the pin icon.


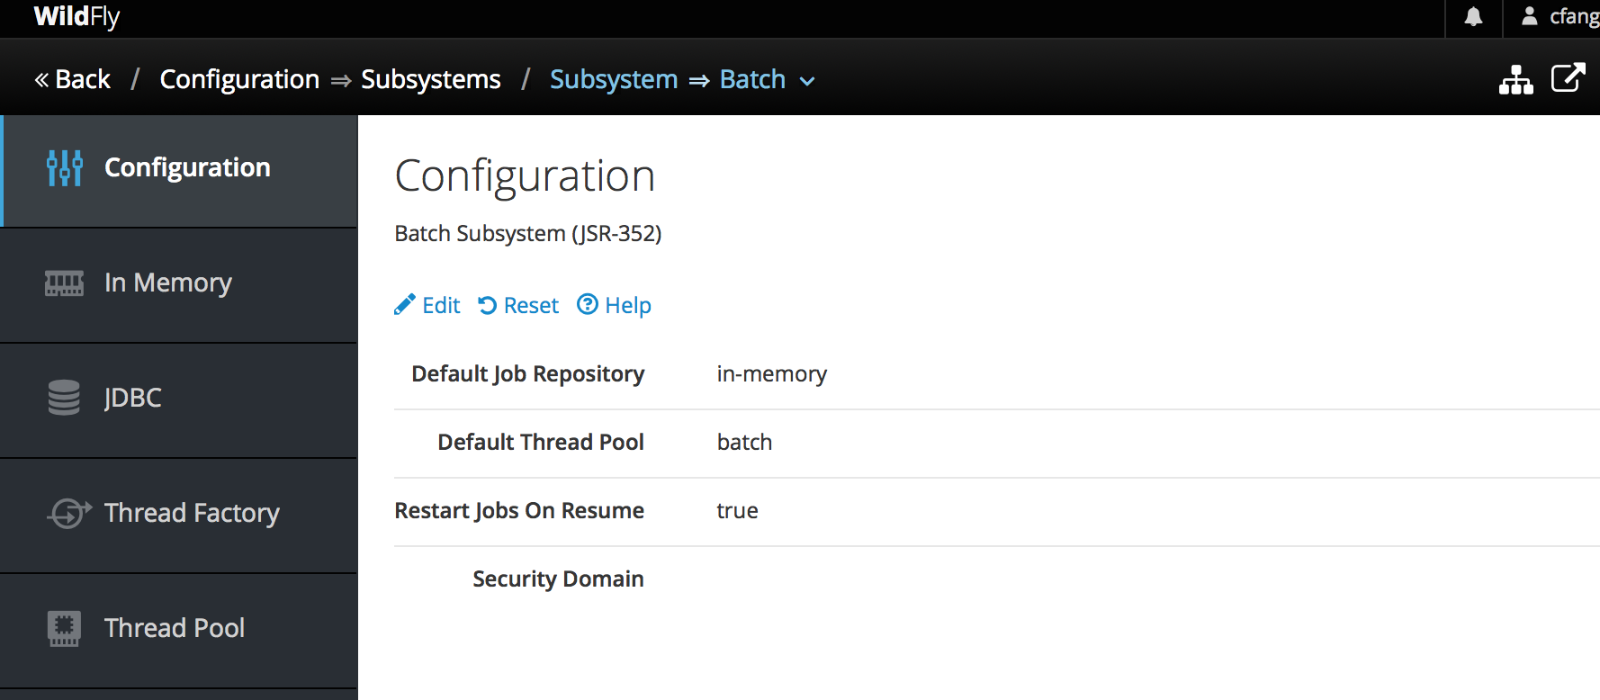
Clicking the View button brings up the batch subsystem configuration page, which shows the current top-level configuration, along with three clickable links:

  • Edit: changes the current batch subsystem top-level configuration, such as changing default job repository from in-memory to jdbc type;
  • Reset: resets all non-required fields to their initial or default values;
  • Help: clicking it will open a light-green text field below that explains each configuration items


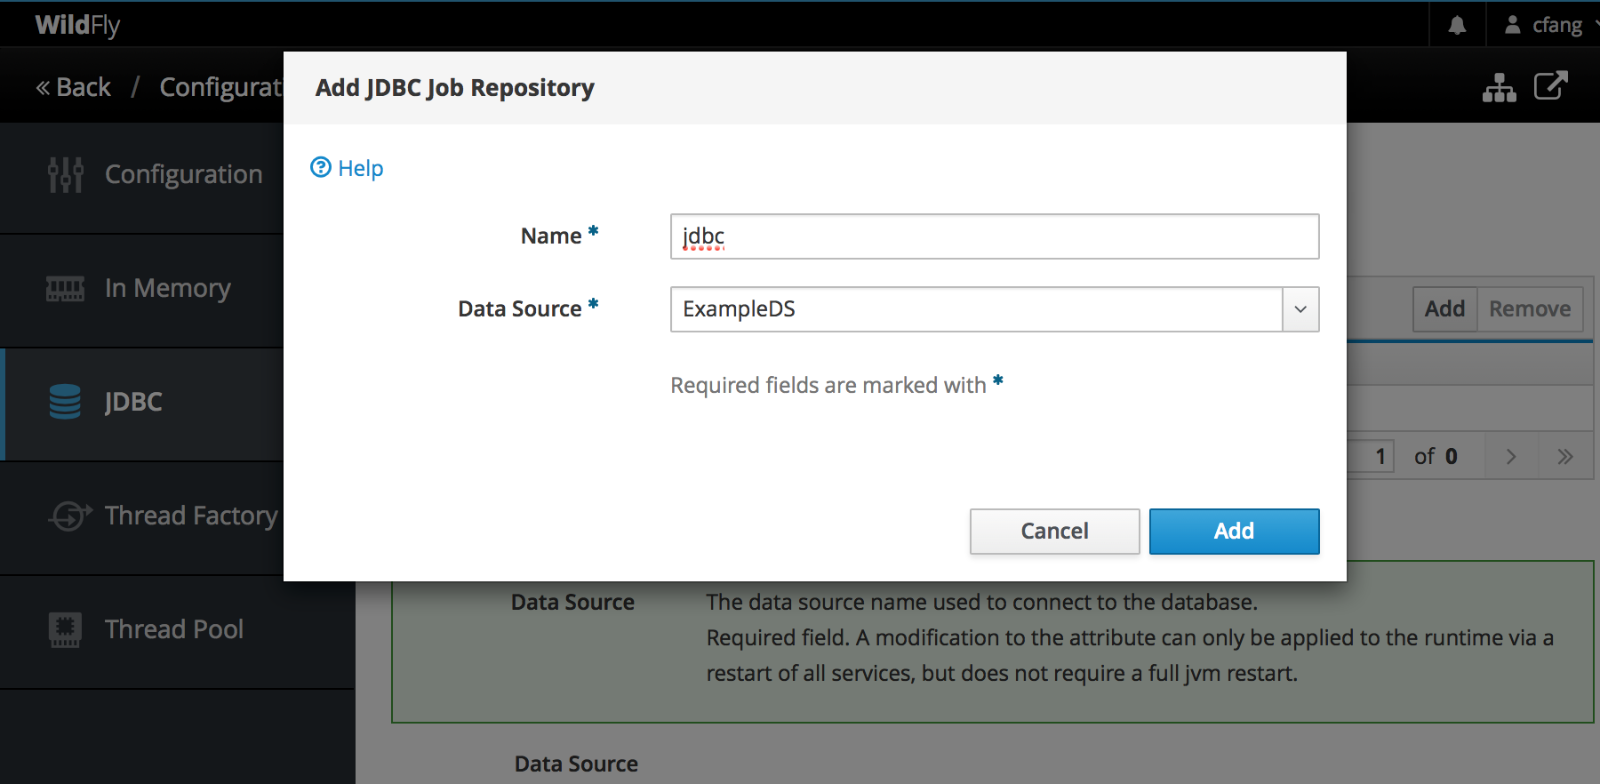
The left panel lists all sub-elements of batch subsystem configuration, i.e., In-Memory Job Repository, JDBC job repository, Thread Factory, and Thread Pool. The most commonly used sub-element is JDBC Job Repository, which stores all batch job execution data in the backing database.  The following page shows how to create a new JDBC Job Repository.  ExampleDS is the default data source name in WildFly and is used here for illustration purpose only.  Typically you need to configuring your own JDBC driver and data source based on your DBMS product.


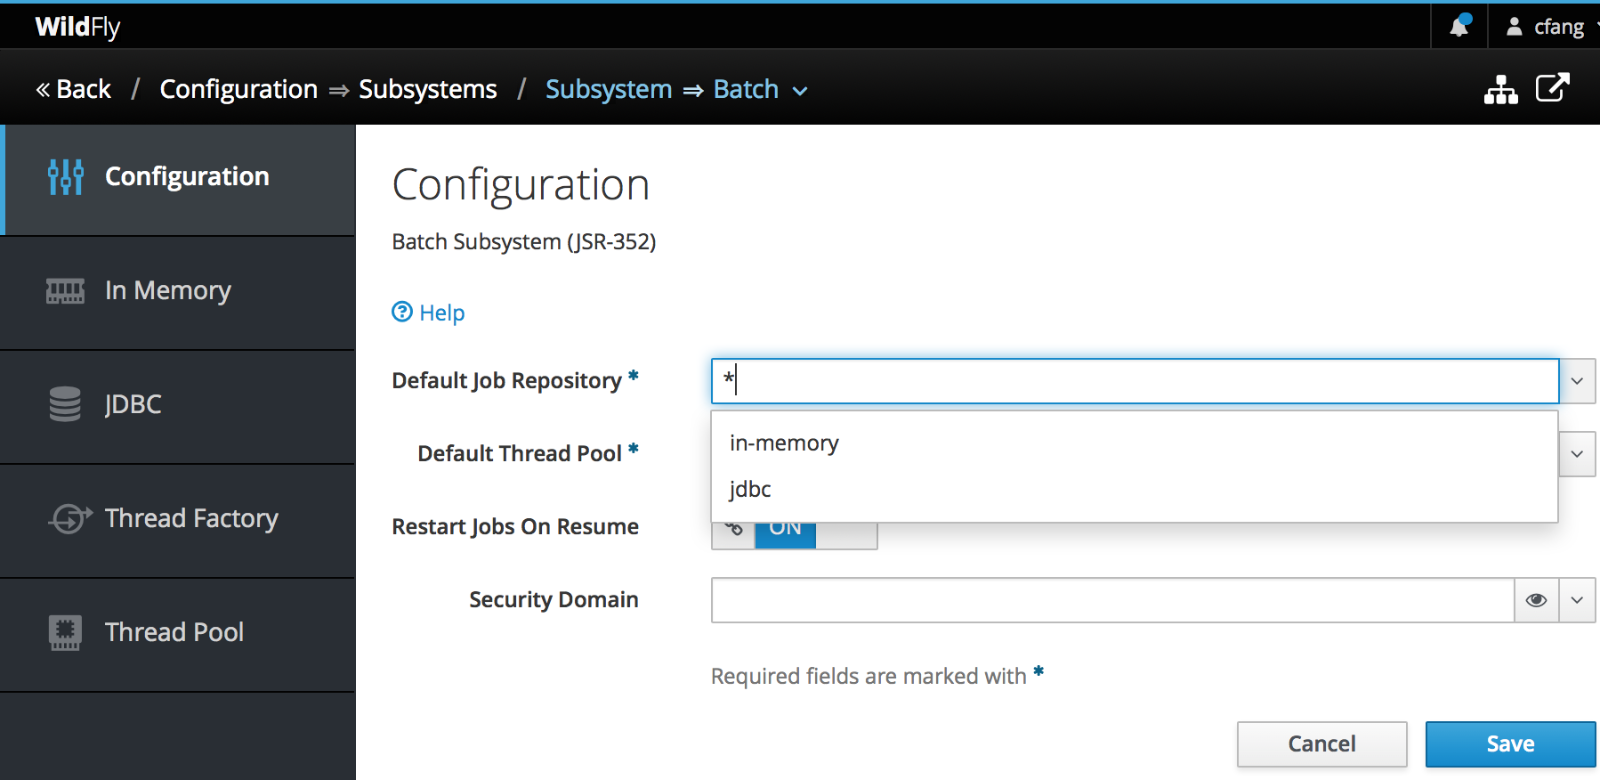
You may repeat the above procedure to create multiple JDBC Job Repositories for different applications or purposes.  To use a JDBC Job Repository as the default job repository, remember to set it in the batch subsystem Configuration overview page:


Deploy Batch Applications


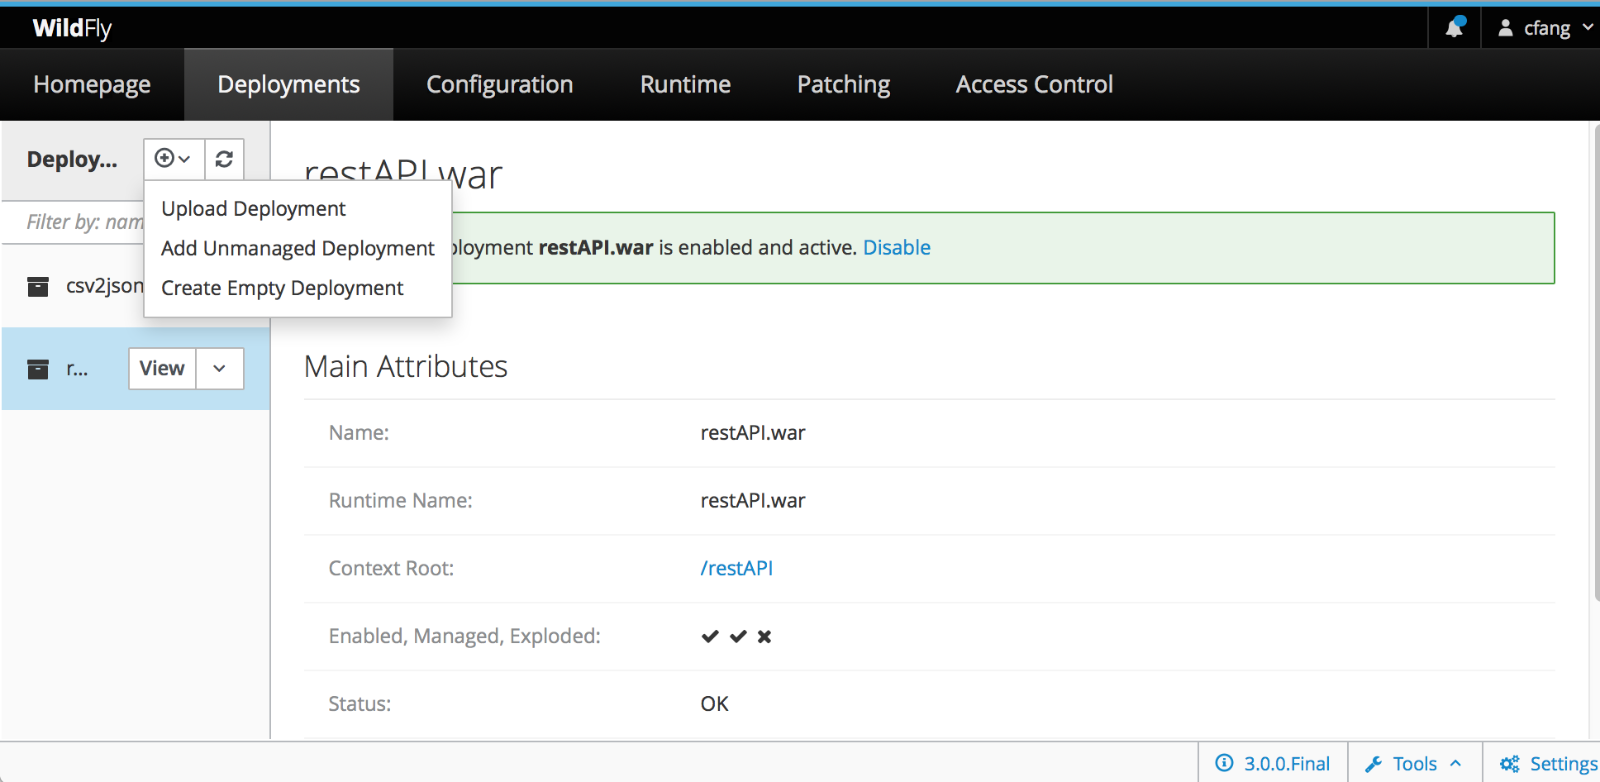
Deployment task is so common that it appears in the first section on the admon console landing page, where you can click the Start button to deploy a batch application and enable it.  Alternatively, you can click the Deployments tab on the top of the page to bring up the deployment wizard:


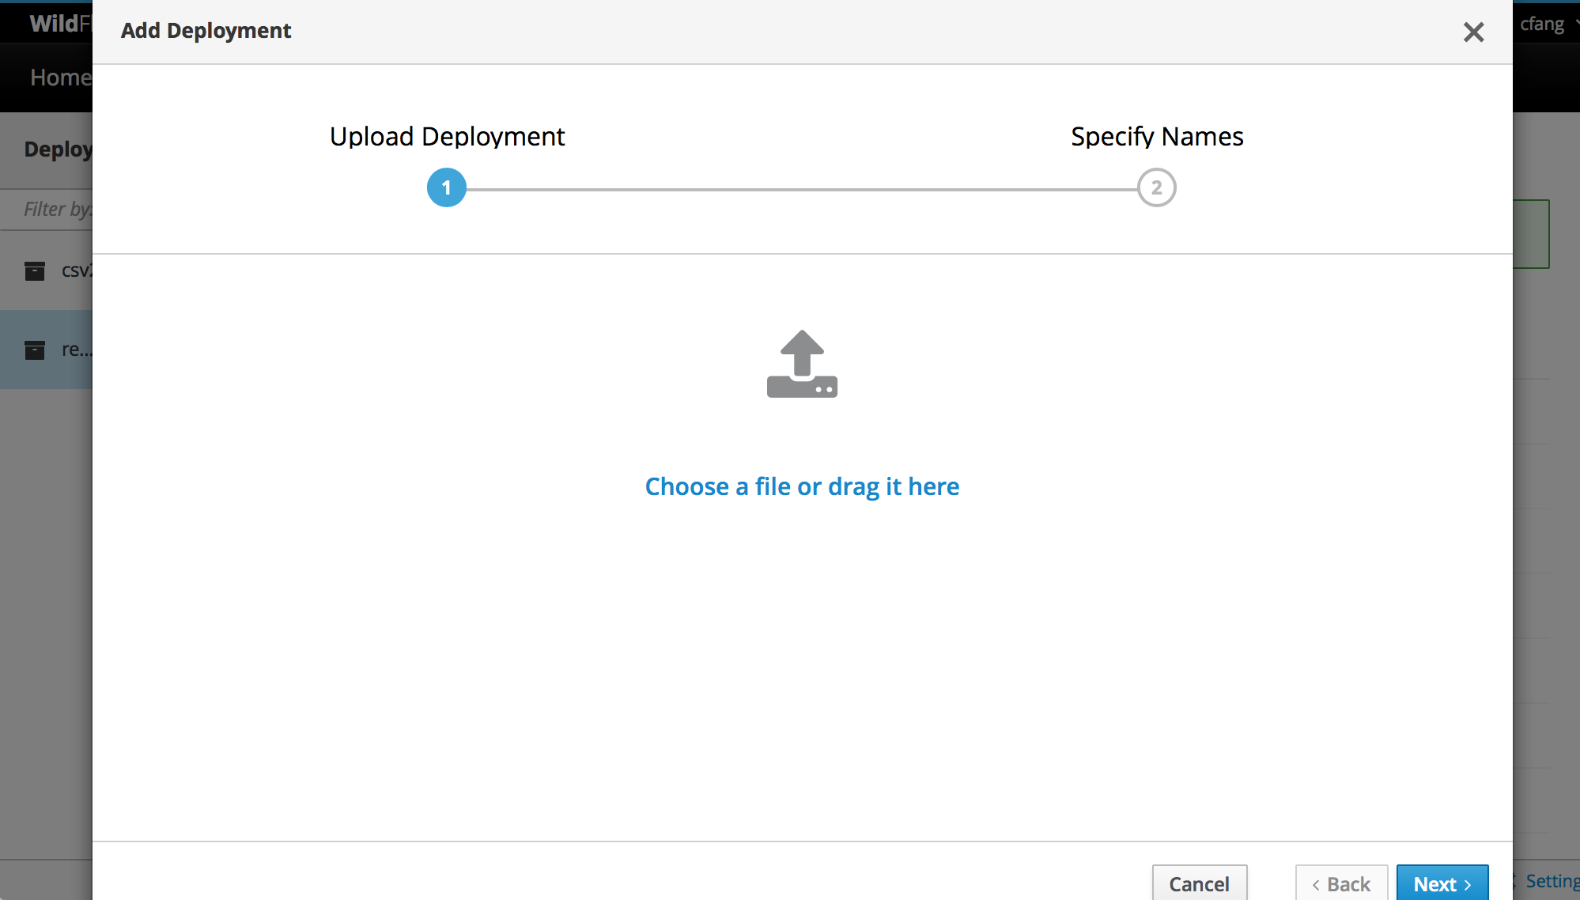
Clicking Upload Deployment in the pull-down list, and you will be able to choose the application to deploy from local file system:


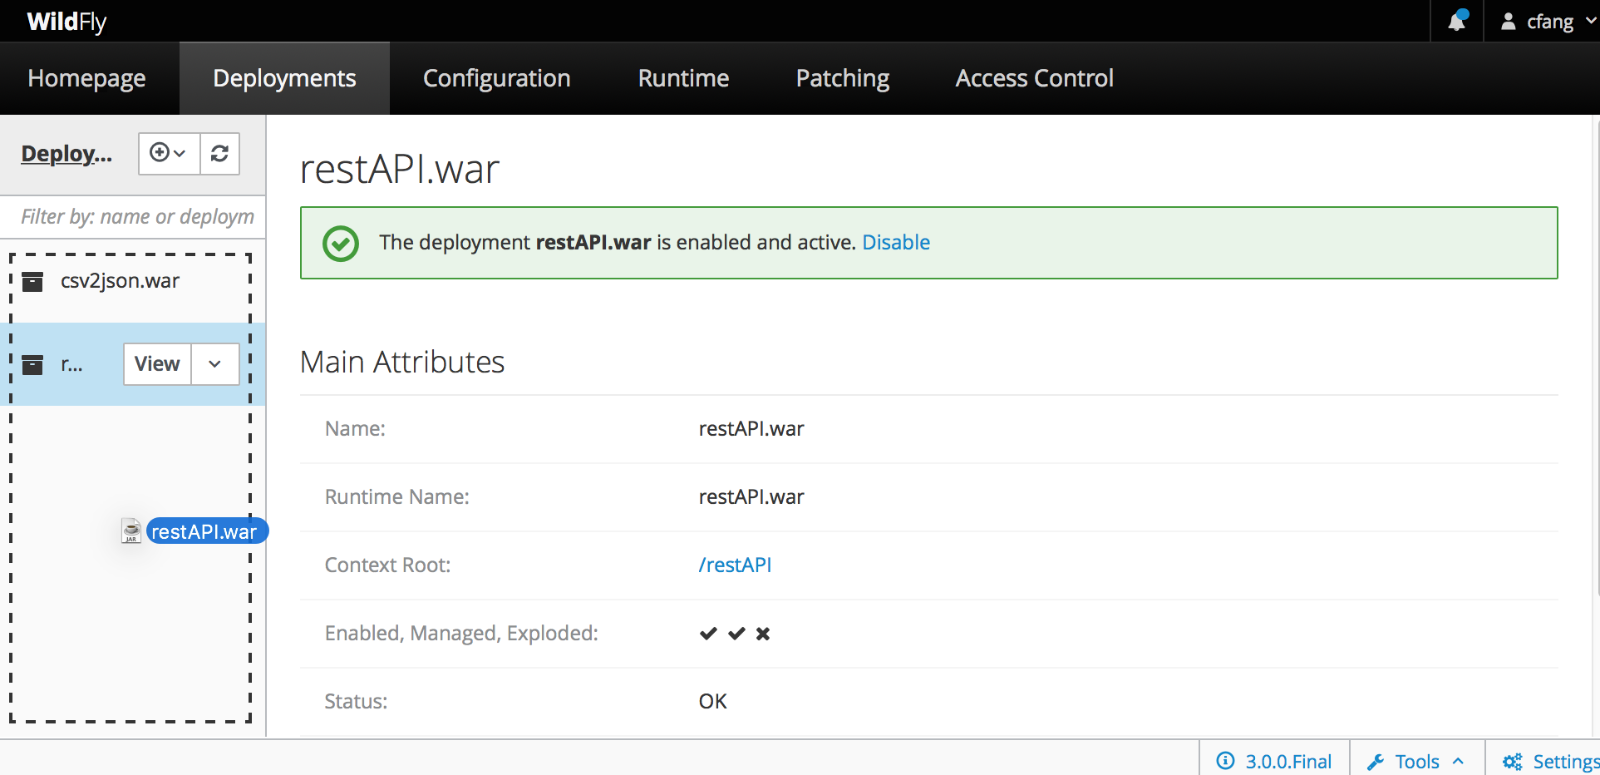
As a short-cut, you can also directly drag-and-drop your application archive to the left panel in Deployments page:


Notice the dashed border as a visual cue as you drag the application and enter the left deployments panel.  Batch applications deployed this way are enabled and active immediately.  Any existing applications with the same name will be replaced (i.e., redeployed).


To disable and remove (undeploy) an application, simply expand the pull-down menu to the right of the View button, and choose the appropriate action.


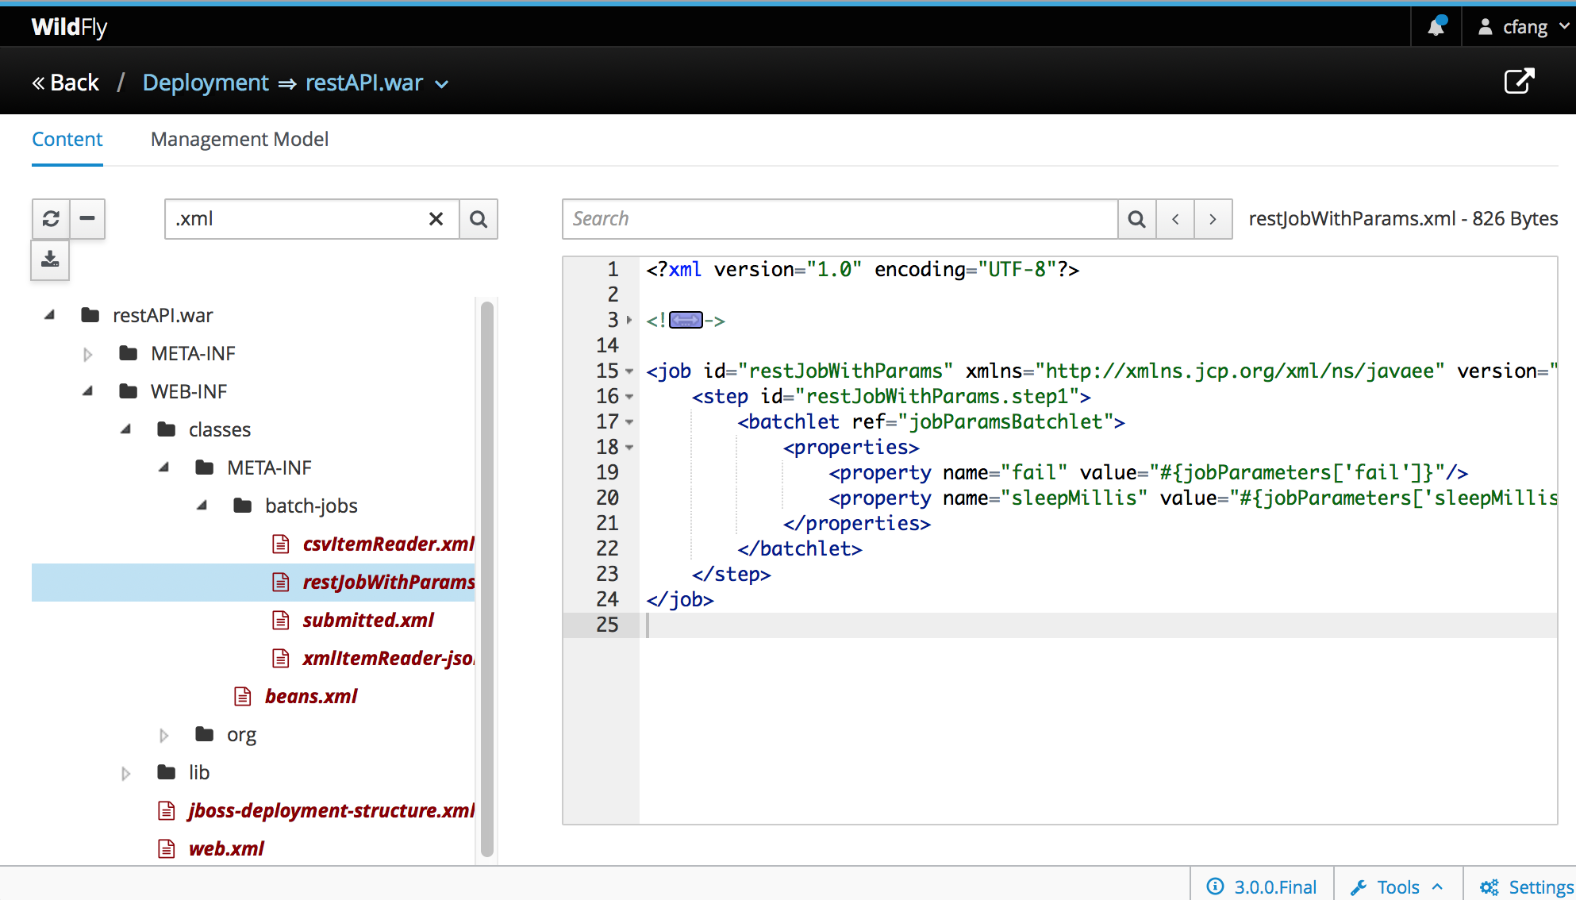
Oftentimes an application developer or administrator wants to view the application content, especially configuration, in order to better understand the application behavior. This is easily done in WildFly 13 admin console.  You can follow the application View button in Deployments page to visit the application details page:


The breadcrum on the top of the page and the pull-down arrow allows you to easily switch between all deployed applications.  I found the easiest way to locate a file within the deployment is searching by partial file name.  In the above screenshot, I searched with ".xml" to quickly locate all XML configuration files including batch job files and deployment descriptors.


The right panel displays the content for supported file types, with syntax hightlighting and elements expanding/collapsing.  For batch applications, it comes handy to be able to view batch job definitions in server admin console.


Monitor Batch Runtime and Start Jobs


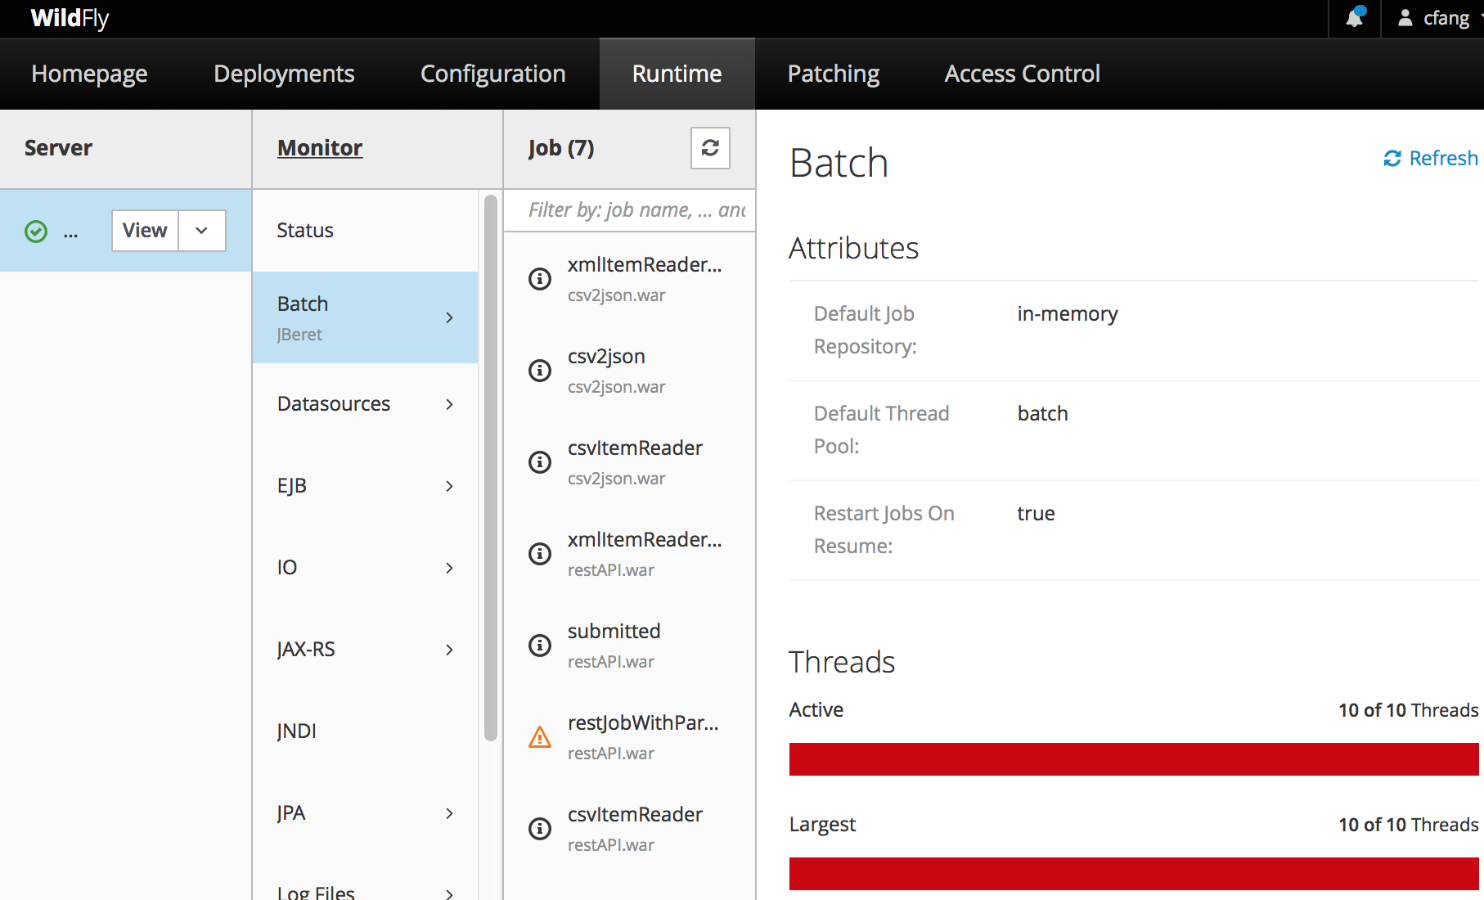
To monitor batch runtime, click Runtime tab on the top of the page, and then choose to monitor batch jberet.  Here you can view batch runtime stats, all batch jobs known to the batch runtime and their associated application.


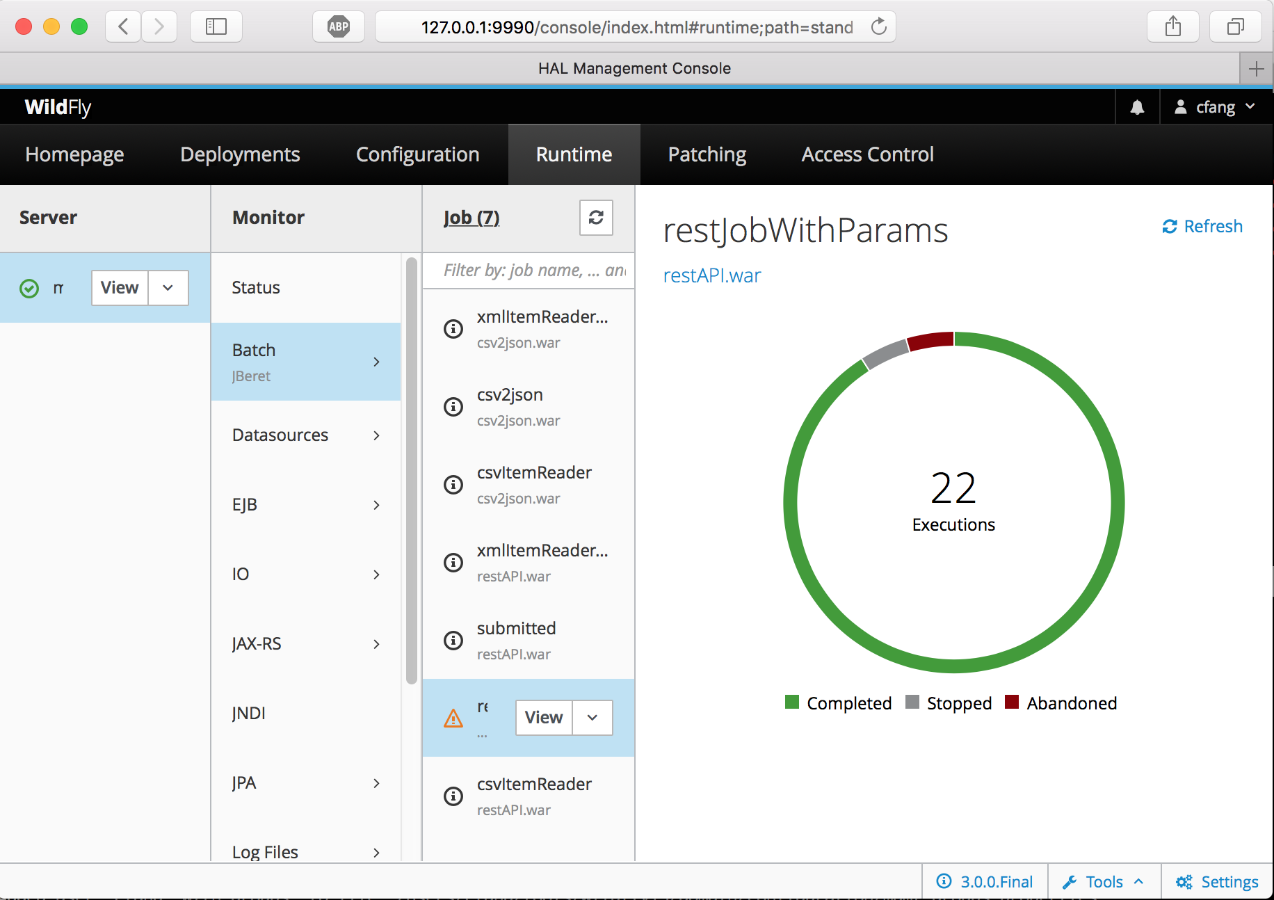
After selecting a job in the jobs list, the right panel will display the number of job executions for this job and their batch status:


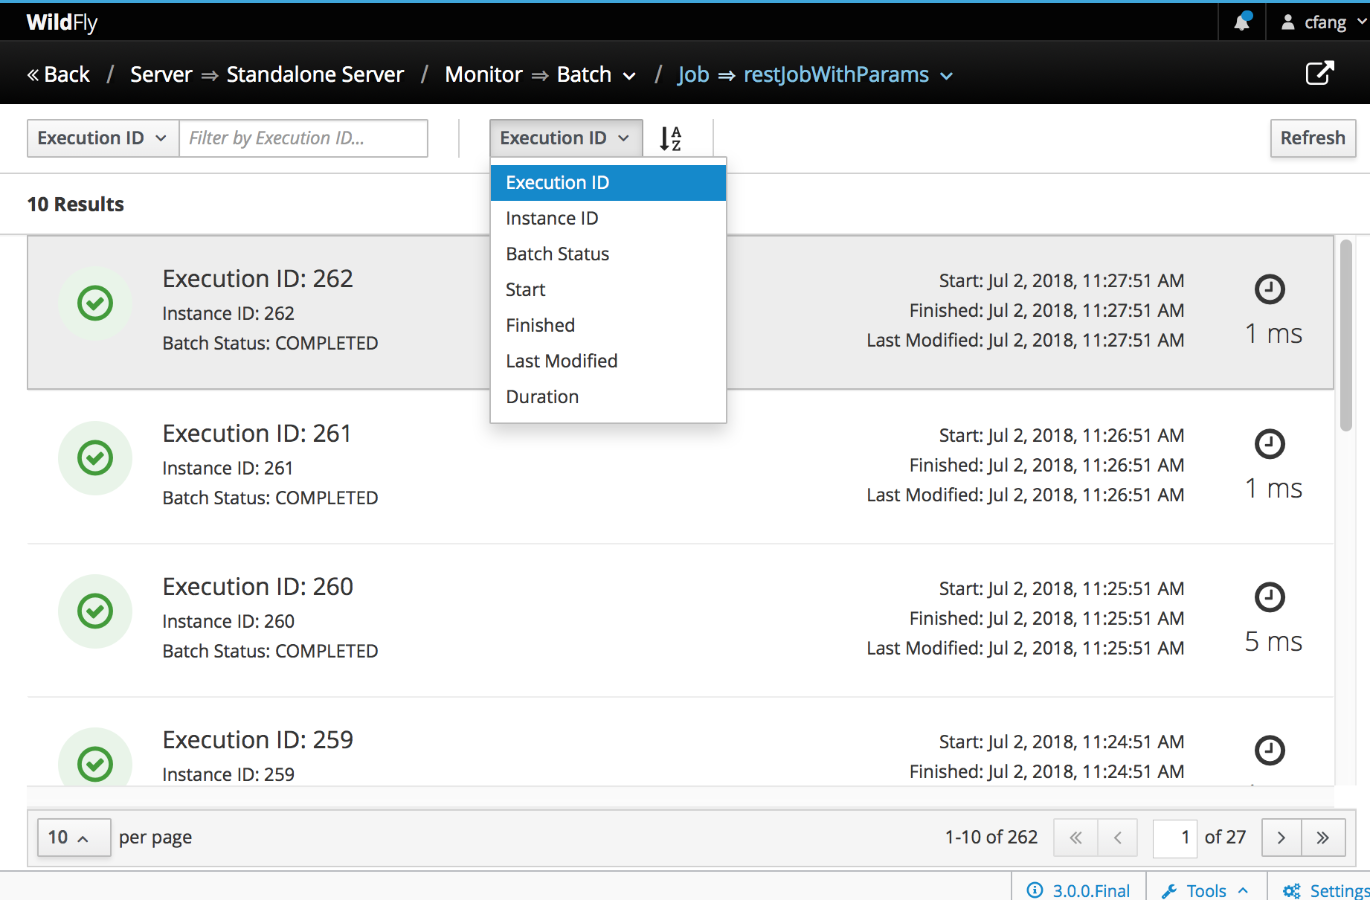
Click View button to display details of all job executions belonging to this job.  The page supports pagination, sorting and filtering with various attributes.  For example, you can view all failed job executions by filtering with Batch Status "FAILED".


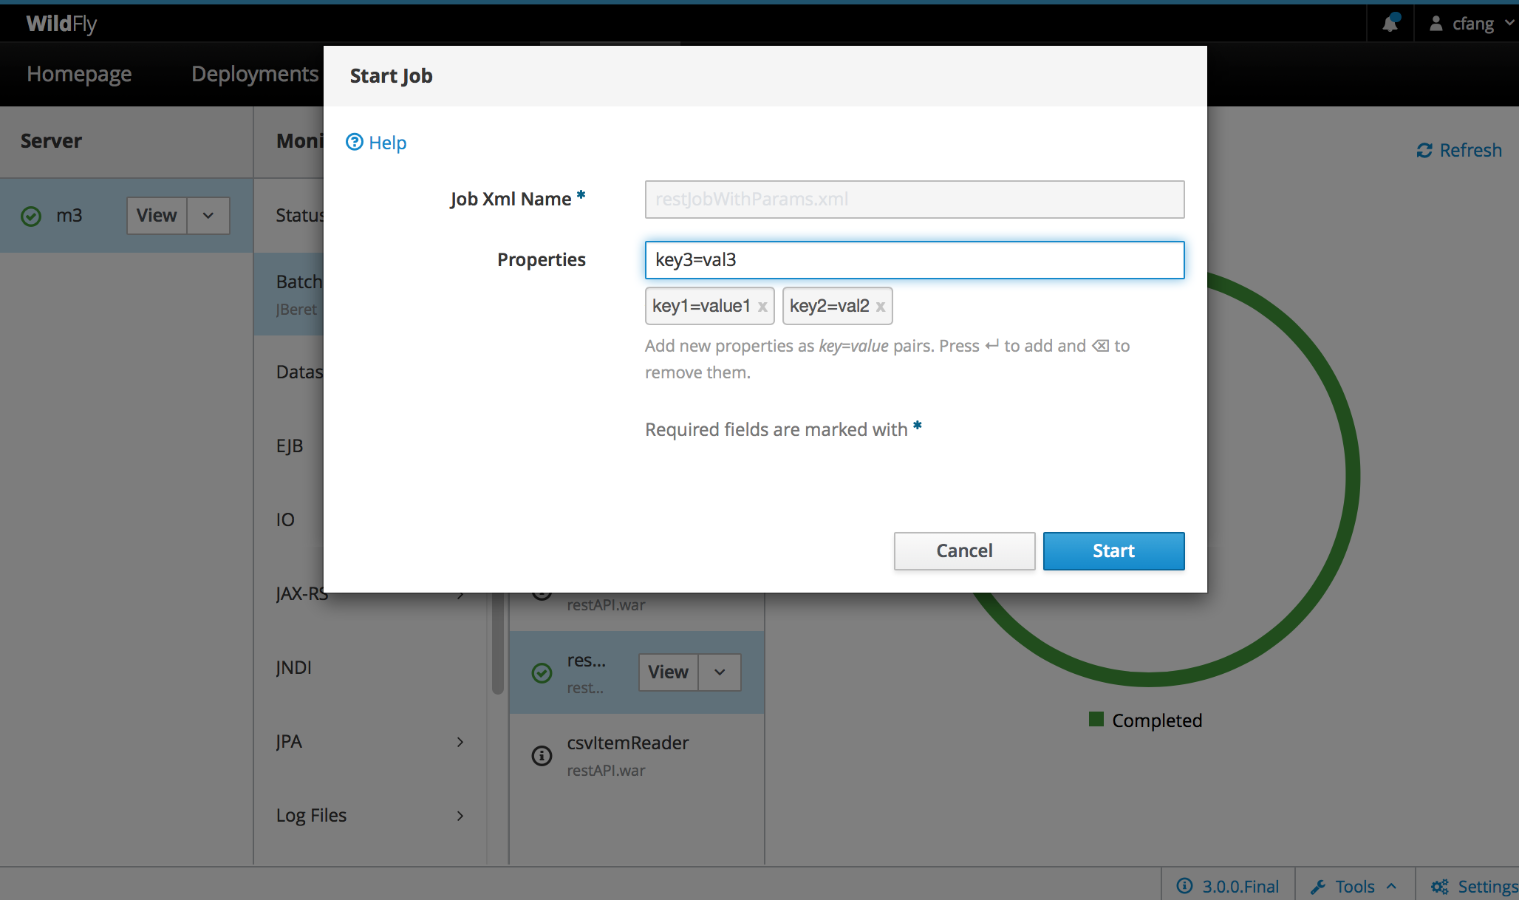
To start running a batch job, click the pull-down arrow next to the View button, and choose Start.  The ensuing pop-up window allows you to add job parameters to be used for this job execution, before clicking the Start button to start it.


Summary


In this post, we explored various batch subsystem configuration and common tasks in deploying and managing a batch application.  I hope you find it useful and I would also encourage batch application developers to leverage these features in WildFly admin console, and get involved in WildFly.  Last but not least, kudos to upstream project HAL Management Console for implementing all these features.

WildFly supports batch processing through its batch-jberet subsystem, which can be configured to use either a in-memory or jdbc job repository.  The in-memory batch job repository, the default one, requires no extra configuration and allows for quick batch application development and deployment.  For more advanced batch processing applications that call for persistence job data and access to shared job data between multiple WildFly instances, a jdbc job repository is required.  In this blog post, I'll go through key steps how to configure and use a jdbc job repository backed by PostgreSQL database.


Configure PostgreSQL JDBC Module, Driver and Datasource in WildFly


Have a PostgreSQL database server installed either locally or remotely, accessible to WildFly.  For writing this post, I have a locally running PostgreSQL server with the following configuration:


version10
hostlocalhost
port5432 (the default port number)
database userpostgres
database passwordnone
database namepostgres (same as database user)
jdbc connection urljdbc:postgresql://localhost/postgres


Download PostgreSQL jdbc driver jar from the vendor website.  Choose the version that is compatible with your PostgreSQL database server.


Create a JBoss module for PostgreSQL jdbc driver jar in WildFly, by creating the module directory structure, copying jdbc driver jar to here and creating module.xml for this new module:


$ mkdir -p $JBOSS_HOME/modules/org/postgresql/driver/main/
$ cp ~/Downloads/postgresql-42.2.2.jar $JBOSS_HOME/modules/org/postgresql/driver/main/


Create module.xml under org/postgresql/main/ directory, with the following content:


<module xmlns="urn:jboss:module:1.3" name="org.postgresql.driver">

<resources>

  <resource-root path="postgresql-42.2.2.jar" />

</resources>

<dependencies>

  <module name="javax.api"/>

  <module name="javax.transaction.api"/>

</dependencies>

</module>


Create PostgreSQL jdbc driver and datasource resources in WildFly with CLI:


$ cd $JBOSS_HOME/bin
$ ./jboss-cli.sh --connect

[standalone@localhost:9990 /] /subsystem=datasources/jdbc-driver=postgres:add(driver-name=postgres, driver-module-name=org.postgresql.driver, driver-class-name=org.postgresql.Driver, driver-xa-datasource-class-name=org.postgresql.xa.PGXADataSource)

[standalone@localhost:9990 /] data-source add --name=PostgresDS --jndi-name=java:jboss/PostgresDS --driver-name=postgres --connection-url=jdbc:postgresql://localhost/postgres --user-name=postgres --enabled=true --use-java-context=true --jta=true

Configure and Access Batch Subsystem in WildFly


Create batch jdbc job repository using PostgreSQL datasource, and register it as the default batch job repository:


/subsystem=batch-jberet/jdbc-job-repository=jdbc:add(data-source=PostgresDS)
/subsystem=batch-jberet/:write-attribute(name=default-job-repository, value=jdbc)
:reload


To view the current configuration for WildFly batch subsystem:


/subsystem=batch-jberet:read-resource(recursive=true)
{
    "outcome" => "success",
    "result" => {
        "default-job-repository" => "jdbc",
        "default-thread-pool" => "batch",
        "restart-jobs-on-resume" => true,
        "security-domain" => undefined,
        "in-memory-job-repository" => {"in-memory" => {}},
        "jdbc-job-repository" => {"jdbc" => {"data-source" => "PostgresDS"}},
        "thread-factory" => undefined,
        "thread-pool" => {"batch" => {
            "keepalive-time" => {
                "time" => 30L,
                "unit" => "SECONDS"
            },
            "max-threads" => 10,
            "name" => "batch",
            "thread-factory" => undefined
        }}
    }
}


To view batch job data for a specific application:


/deployment=restAPI.war/subsystem=batch-jberet:read-resource(recursive=true, include-runtime=true)

{
    "outcome" => "success",
    "result" => {
        "job-xml-names" => [
            "restJob2.xml",
            "restJob3.xml",
            "restJob1.xml",
            "submitted.xml",
            "restJobWithParams.xml",
            "org.jberet.test.infinispanRepository.xml"
        ],
        "job" => {
            "restJob2" => {
                "instance-count" => 2,
                "job-xml-names" => ["restJob2.xml"],
                "running-executions" => 0,
                "execution" => {
                    "25" => {
                        "batch-status" => "COMPLETED",
                        "create-time" => "2018-06-05T18:07:20.858+0000",
                        "end-time" => "2018-06-05T18:07:20.870+0000",
                        "exit-status" => "COMPLETED",
                        "instance-id" => 23L,
                        "last-updated-time" => "2018-06-05T18:07:20.870+0000",
                        "start-time" => "2018-06-05T18:07:20.862+0000"
                    },
                    "2" => {
                        "batch-status" => "COMPLETED",
                        "create-time" => "2018-06-05T18:02:07.183+0000",
                        "end-time" => "2018-06-05T18:02:07.218+0000",
                        "exit-status" => "COMPLETED",
                        "instance-id" => 2L,
                        "last-updated-time" => "2018-06-05T18:02:07.218+0000",
                        "start-time" => "2018-06-05T18:02:07.190+0000"
                    }
                }
            },

...


Query Batch Job Data with PostgreSQL Client Tool


Another way to access batch job data is to query batch jdbc job repository with PostgreSQL client tool, such as psql.  This offers a direct access to the underlying database for the batch job repository, and therefore shoud be used with great caution.


To start psql and connect with user postgres and database postgres:


$ psql --U postgres
postgres=#


To view available tables in postgres database:


postgres=# \dt
                List of relations
 Schema |        Name         | Type  |  Owner
--------+---------------------+-------+----------
 public | job_execution       | table | postgres
 public | job_instance        | table | postgres
 public | partition_execution | table | postgres
 public | step_execution      | table | postgres
(4 rows)


To vew table schemas for a specific table:


postgres=# \d job_execution
                                               Table "public.job_execution"
     Column      |           Type           | Collation | Nullable |                        Default
-----------------+--------------------------+-----------+----------+-------------------------------------------------------
 jobexecutionid  | bigint                   |           | not null | nextval('job_execution_jobexecutionid_seq'::regclass)
 jobinstanceid   | bigint                   |           | not null |
 version         | integer                  |           |          |
 createtime      | timestamp with time zone |           |          |
 starttime       | timestamp with time zone |           |          |
 endtime         | timestamp with time zone |           |          |
 lastupdatedtime | timestamp with time zone |           |          |
 batchstatus     | character varying(30)    |           |          |
 exitstatus      | character varying(512)   |           |          |
 jobparameters   | character varying(3000)  |           |          |
 restartposition | character varying(255)   |           |          |
Indexes:
    "job_execution_pkey" PRIMARY KEY, btree (jobexecutionid)
Foreign-key constraints:
    "fk_job_execution_job_instance" FOREIGN KEY (jobinstanceid) REFERENCES job_instance(jobinstanceid) ON DELETE CASCADE
Referenced by:
    TABLE "step_execution" CONSTRAINT "fk_step_exe_job_exe" FOREIGN KEY (jobexecutionid) REFERENCES job_execution(jobexecutionid) ON DELETE CASCADE


To query job execution data in chronological order:


postgres=# select jobexecutionid, endtime, batchstatus from job_execution order by jobexecutionid desc limit 10;
 
jobexecutionid |          endtime           | batchstatus
----------------+----------------------------+-------------
             28 | 2018-06-10 11:08:32.531-04 | COMPLETED
             27 | 2018-06-05 14:07:21.009-04 | COMPLETED
             26 | 2018-06-05 14:07:20.923-04 | COMPLETED
             25 | 2018-06-05 14:07:20.87-04  | COMPLETED
             24 | 2018-06-05 14:07:20.315-04 | COMPLETED
             23 | 2018-06-05 14:07:20.281-04 | COMPLETED
             22 | 2018-06-05 14:07:19.715-04 | COMPLETED
             21 | 2018-06-05 14:07:19.192-04 | FAILED
             20 | 2018-06-05 14:07:18.618-04 | COMPLETED
             19 | 2018-06-05 14:07:18.01-04  | COMPLETED
(10 rows)


To view job instance data:


postgres=# select * from job_instance order by jobinstanceid desc limit 5;

 jobinstanceid | version |      jobname      | applicationname
---------------+---------+-------------------+-----------------
            26 |         | restJob1          | restAPI
            25 |         | restJob1          | restAPI
            24 |         | restJob1          | restAPI
            23 |         | restJob2          | restAPI
            22 |         | restJobWithParams | restAPI
(5 rows)


To view step execution data:


postgres=# select stepexecutionid, stepname, starttime, batchstatus, commitcount from step_execution order by stepexecutionid desc limit 10;
 stepexecutionid |        stepname         |         starttime          | batchstatus | commitcount
-----------------+-------------------------+----------------------------+-------------+-------------
              28 | restJob1.step1          | 2018-06-10 11:08:32.508-04 | COMPLETED   |           0
              27 | restJob1.step1          | 2018-06-05 14:07:20.996-04 | COMPLETED   |           0
              26 | restJob1.step1          | 2018-06-05 14:07:20.913-04 | COMPLETED   |           0
              25 | restJob2.step1          | 2018-06-05 14:07:20.864-04 | COMPLETED   |           0
              24 | restJobWithParams.step1 | 2018-06-05 14:07:20.308-04 | COMPLETED   |           0
              23 | restJobWithParams.step1 | 2018-06-05 14:07:20.272-04 | COMPLETED   |           0
              22 | restJobWithParams.step1 | 2018-06-05 14:07:19.71-04  | COMPLETED   |           0
              21 | restJobWithParams.step1 | 2018-06-05 14:07:19.182-04 | FAILED      |           0
              20 | restJobWithParams.step1 | 2018-06-05 14:07:18.609-04 | COMPLETED   |           0
              19 | restJobWithParams.step1 | 2018-06-05 14:07:18.004-04 | COMPLETED   |           0
(10 rows)


Summary


This post demonstrates how to configure PostgreSQL driver, datasource, and batch jdbc job repository with WildFly CLI commands. Batch application developers can use CLI commands to not only configure WildFly subsystems, but also access batch data and perform certain batch processing operations. SQL tools such as PostgreSQL psql offer a more direct way of access and sometimes even modify batch job data (e.g., manually updating batch status for crashed applications).  Therefore, such direct access to batch job repository should be done with great caution so as not to corrupt batch job repository data.