RichFaces Chart: Part 1 - Introduction
Posted by michpetrov in Michal Petrov's Blog on Oct 6, 2014 12:14:56 PMTaken from Lukáš Macko's blog series on charts, this is an up-to-date version.
Chart component
The chart component has landed in RichFaces. Let’s take a quick look how to use it.
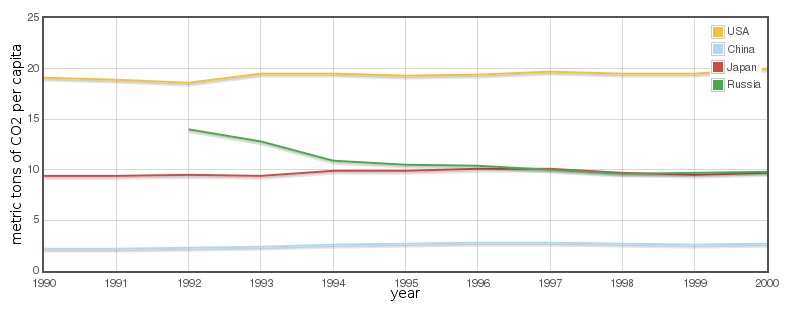
I am going to show steps how to create chart like this. It shows countries carbon dioxide emissions per capita in several years. I am going to use following data. Data are stored in a list of Country objects in a backing bean.
public class Country{
    private String name;
    //CO2 production year-> metric tons per capita
    private List<Record> data;

    public Country(String name){
        this.name = name;
        this.data = new LinkedList<Record>();
    }
    public void put(int year, double tons){
        this.data.add(new Record(year, tons));
    }

    public List<Record> getData() {
        return data;
    }

    public String getName() {
        return name;
    }

    public class Record{
        private int year;
        private double tons;

        public Record(int year, double tons) {
            this.year = year;
            this.tons = tons;
        }

        public double getTons() {
            return tons;
        }

        public int getYear() {
            return year;
        }
    }
}
Country object has name and list of records (year and tons of C02 produced in that year by the country)
Prerequisite: Create JSF maven project (I am not going to dive in details.) with JBOSS public repository enabled.
Create chart
<rich:chart>
   <a4j:repeat value="#{bean.countries}" var="country" >
      <rich:chartSeries label="#{country.name}" type="line">
         <a4j:repeat value="#{country.data}" var="record">
            <rich:chartPoint x="#{record.year}" y="#{record.tons}" />
         </a4j:repeat>
      </rich:chartSeries>
   </a4j:repeat>
   <rich:chartXAxis label="year"/>
   <rich:chartYAxis label="metric tons of CO2 per capita"/>
</rich:chart>
I’ll explain these lines in details. You don’t have to create any extra java Object and fill it. You just pass what you gain from database or wherever and use it. In our case we have backing bean called bean and there is a list of Country objects storing data named countries.
Tag chartSeries represents one line in our chart – the values for one country. It has one mandatory attribute type defining the look of chart. It selects whether the chart displays line, bar or pie.
As you probably noticed, there is missing data in series tag. Data is passed into the series using tag chartPoint. It express one key-value pair/ x,y coordinates of a point in that line.
Tag repeat iterates over an array and it “generates” tags for you. That’s why you see only one series in a facelet and for lines in a chart. The same approach is used with points of each series.
Note: If you prefer more traditional way. You can create chart data model by your self and pass it into the series tag using data attribute. It’ll be shown in another blog.
The source code of the shown example can be found here.
What chart type does component offer?
In this post I am going to describe what types of chart the component allow to create, how to switch among them and other things you should know about it.
The component supports line, bar and pie chart at the moment. The switching among chart type is easy, you change series tag attribute type to corresponding value.
<rich:chart>
   <rich:chartSeries type="line">
      <a4j:repeat value="" var="">
         <rich:chartPoint x="" y=""/>
      </a4j:repeat>
   </rich:chartSeries>
</rich:chart>
Each type expects Number type in y attribute. Line chart allows to use Number and Date (not fully supported yet) type in x attribute. Bar chart allows to use Number, String and Date (not fully supported yet). Pie chart use only String in x attribute.
Line and bar chart allow to use more than one series in a chart if the same type is used in x axis. You can also combine bar and line chart.
Switching among chart types get a little more complicated when you create data model by your self but it is topic for another post.
Links
- Part 1 - Introduction
- Part 2 - Customization
- Part 3 - Event handling
Comments